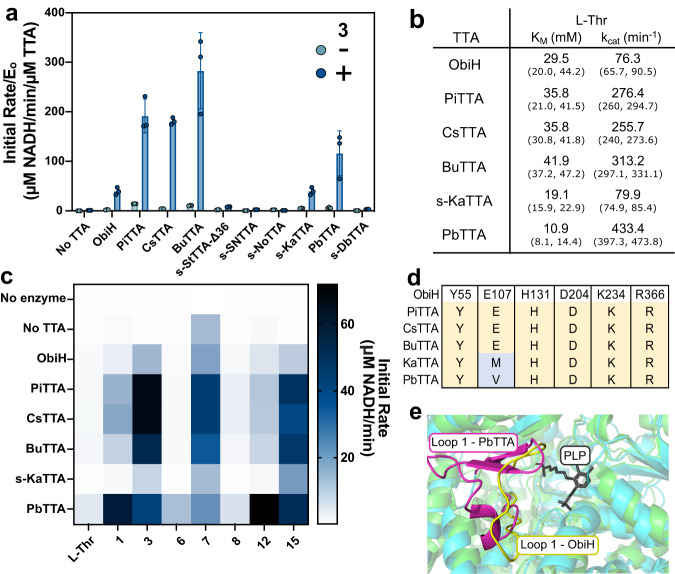
Fig. 4. Characterization of putative threonine transaldolases.
a Screen of all purified TTAs using the TTA-ADH coupled assay on 3. The experiment was performed in triplicate with each replicate as an individual point. Error bars represent standard deviations. b Apparent l-Thr KM and kcat measurements for TTAs that exhibited activity greater than or equal to ObiH calculated using non-linear regression. Parenthetical values represent the 95% confidence interval. c Heatmap showing initial rates for six active TTAs against multiple aromatic aldehyde substrates. d Multi-sequence alignment of the predicted conserved catalytic residues for the six active TTAs. e Superimposed structure and predicted structure illustrating the Tyr55-Pro71 loop region of ObiH compared to the predicted equivalent region for PbTTA. ObiH is represented in green with the loop region highlighted in yellow with the PLP highlighted in gray indicating the region of the active site. The PbTTA is indicated in blue with the corresponding loop region highlighted in pink.

