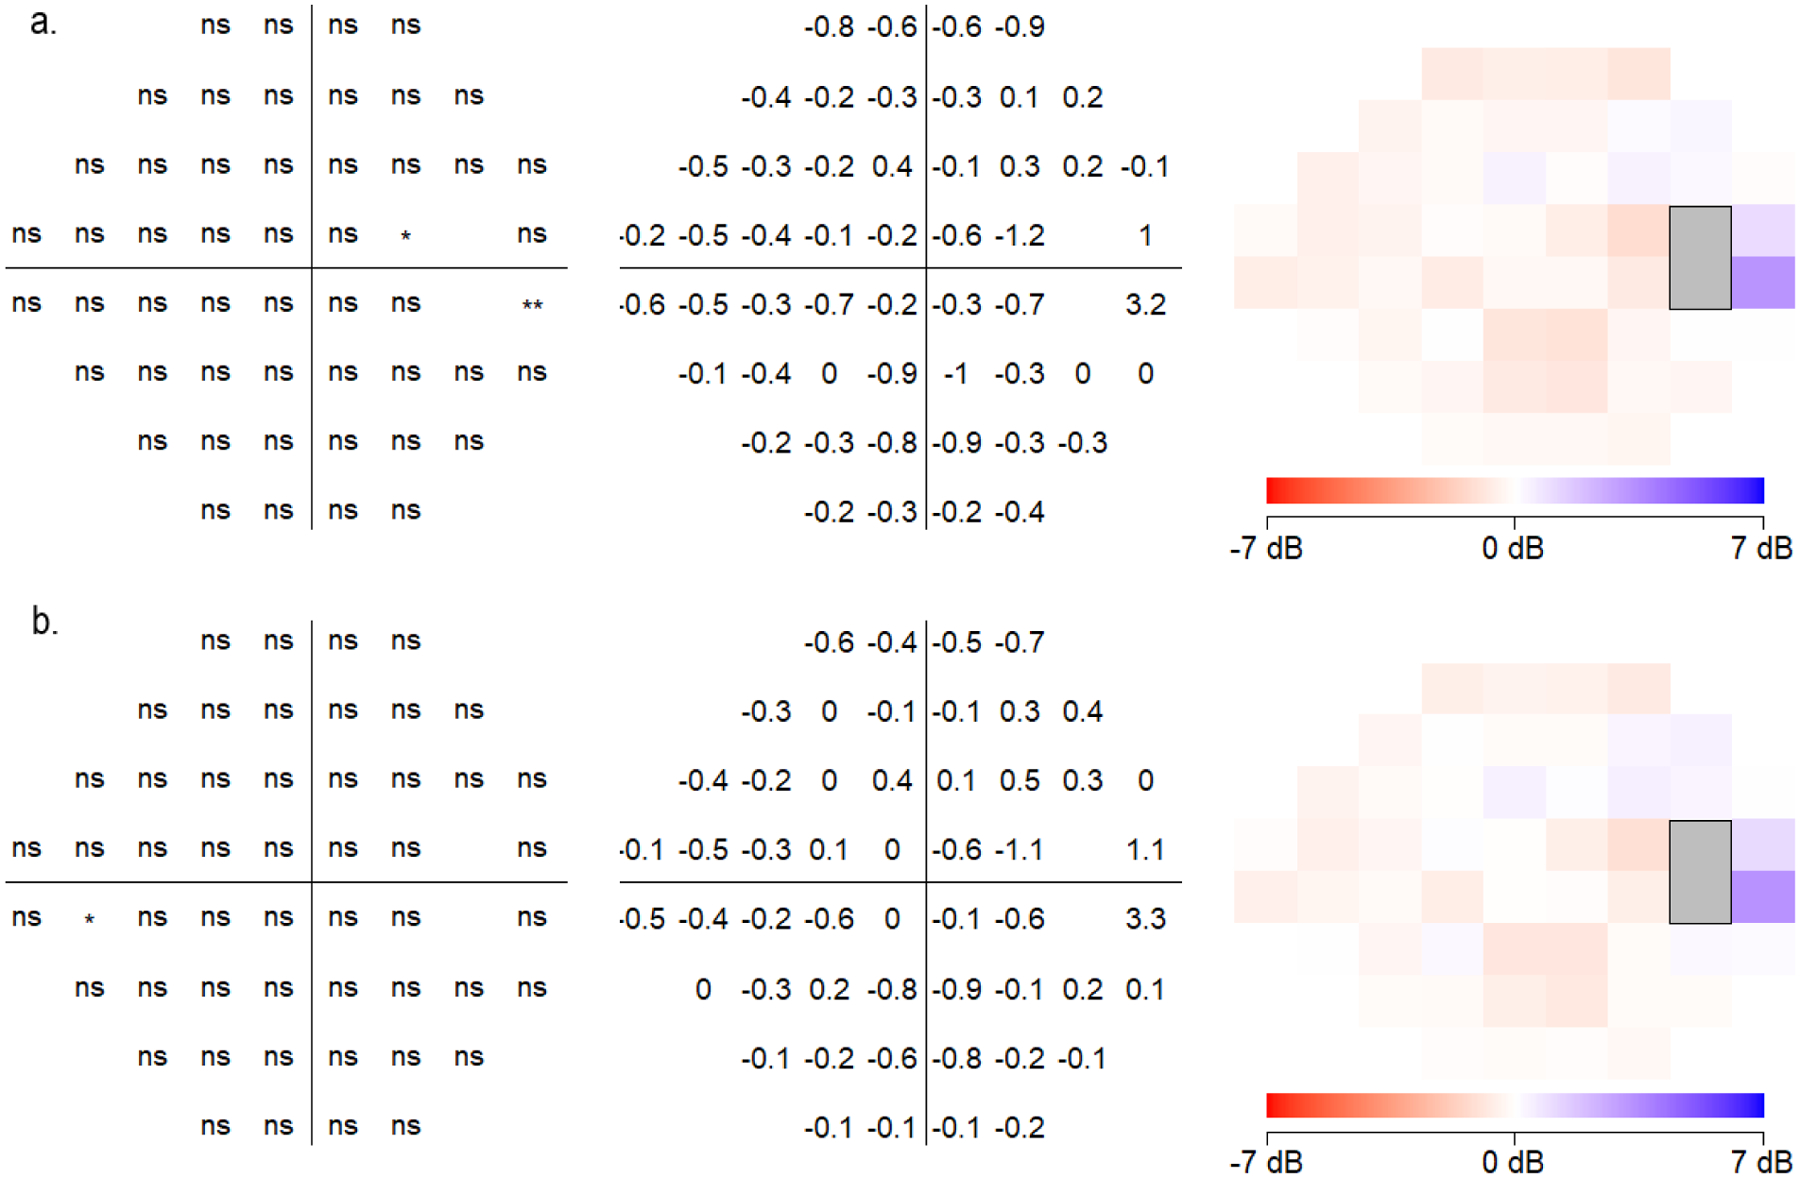
Figure 7:

Point by point analysis of (a) total deviation (TD) and (b) pattern deviation (PD) sensitivities at each testing location comparing the Humphrey Field Analyzer (HFA) and Smart Visual Function Analyzer (SVFA). Locations and degrees of significantly different values are shown (all eyes plotted as right eye).
