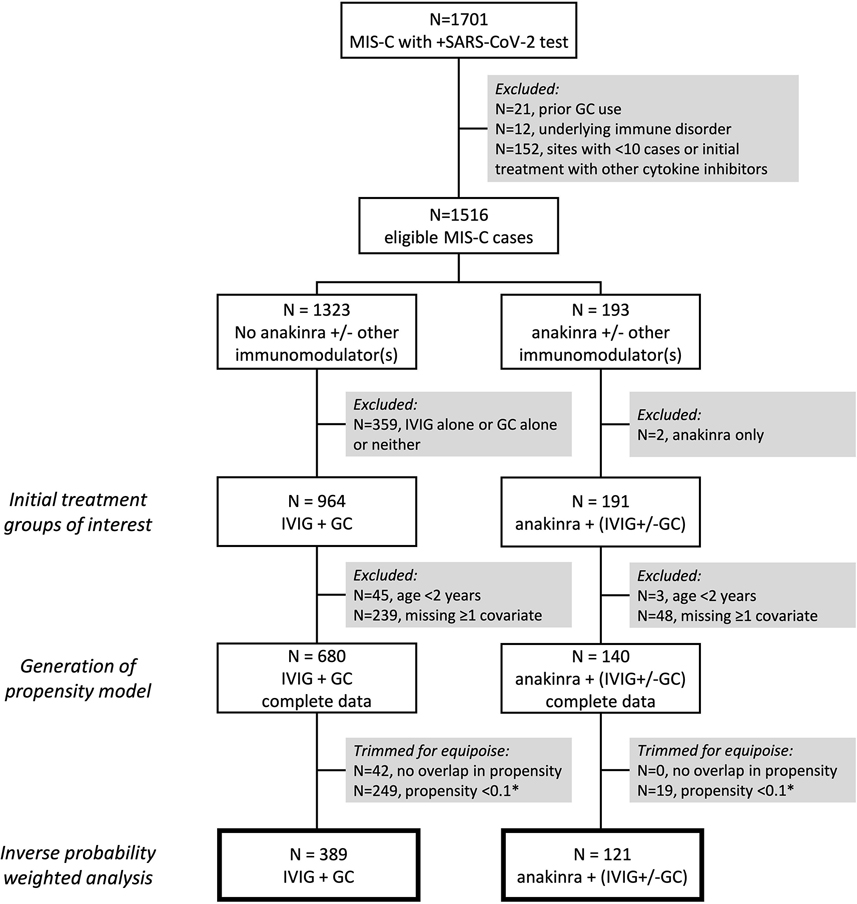
Figure 2.
Flow diagram of selection criteria and sample sizes at each stage of the propensity weighted analysis. Boxes with thick borders indicate the final sample sizes in the inverse probability of treatment weighted estimates of the average treatment effect (ATE) of anakinra plus intravenous immunoglobulin (IVIG) and/or glucocorticoids (GC) compared to IVIG and GC alone. *Cases with a <10% predicted probability of receiving either treatment were removed to preserve clinical equipoise; in this cohort, only those with <10% probability of receiving anakinra needed to be removed, as no cases had <10% probability of receiving only IVIG and GC.

