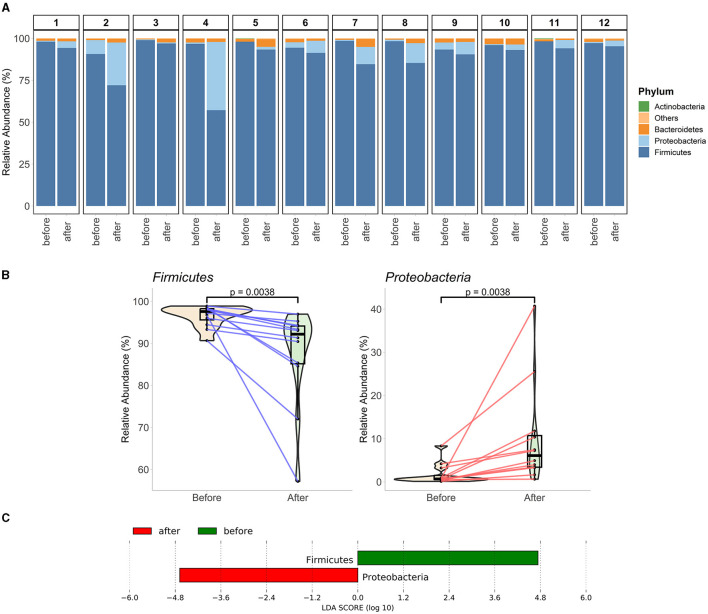
Figure 2.
Phylum-level gut microbiota alterations at the end of fasting. (A) The composition of each paired sample from 12 participants is represented in the phylum level. The top three phyla of each sample are individually represented, while the rest are summed in “Others.” (B) Phyla significantly changes at the end of Ramadan fasting. The mixed violin and box plots (with a black middle line representing the median, and boxes between interquartile ranges of the 25th and 75th percentiles) represent the sample groups before and at the end of Ramadan fasting. Changes between two-time points for each subject are shown by red or blue lines for increased or decreased values, respectively. Wilcoxon rank-sum test was performed to compare two-time groups, and respective p-values are presented on top of the figures. (C) Phyla obtained from LEfSe biomarker discovery analysis. A histogram shows two phyla with their respective LDA scores concerning their differential abundance in participants before and at the end of Ramadan fasting.

