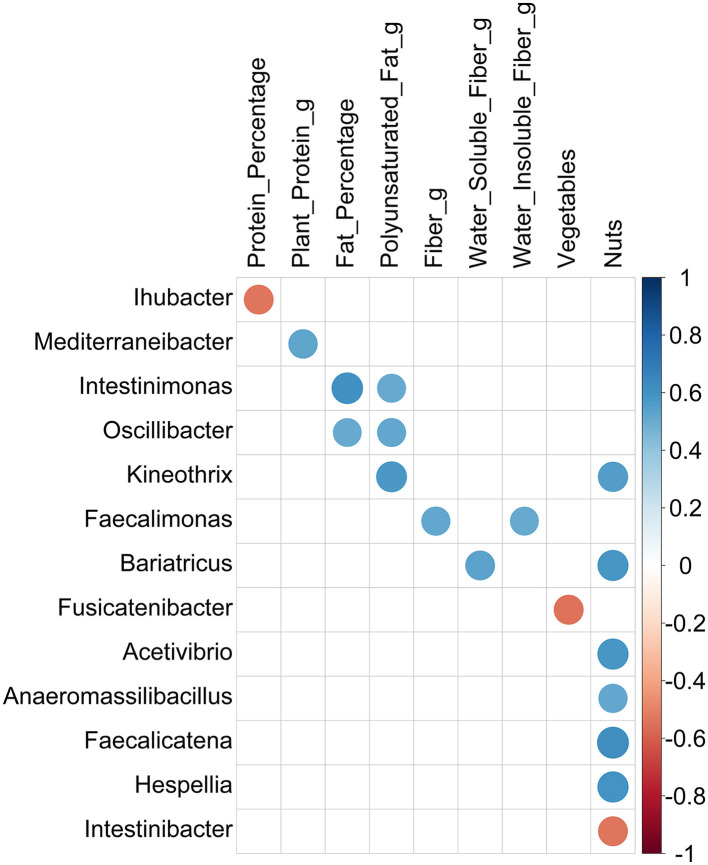
Figure 4.
Correlations between genera and dietary intake measurements filtered by abs (Spearman's rho) ≥ 0.5. Circles represent the correlations passing a significance threshold of 0.05 after Spearman's rank correlation test. The size of the circles is proportional to the correlation coefficient value, and the color illustrates positive (blue) or negative (red) correlation between the two variables.

