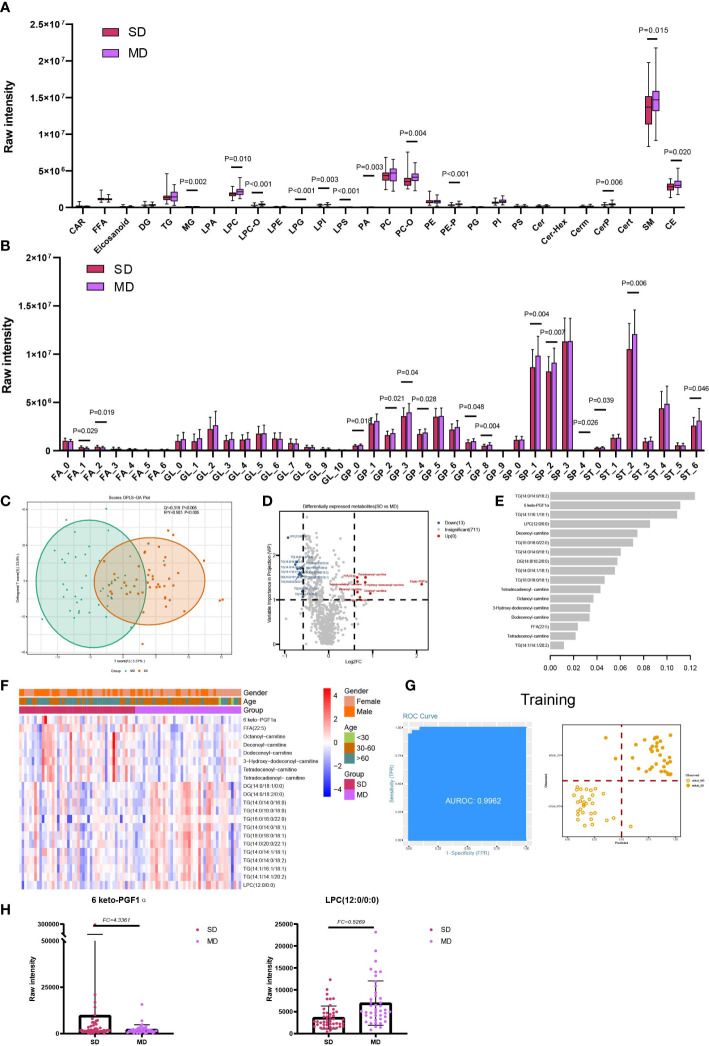
Figure 4.
Lipids associated with the disease severity of COVID-19. (A) The raw intensity of 28 subclasses of lipids in SD vs MD; (B) The raw intensity of different degrees of unsaturation for FA, GL, GP, SP and ST classes in SD vs MD; (C) the OPLS-DA scores plot of SD vs MD. (D) the volcano plot of SD vs MD. Red dots represent the upregulated lipids (FC≥1.5, VIP≥1); blue dots represent the downregulated lipids (FC ≤ 0.67, VIP≥1); gray dots represent lipids without significant changes (0.67<FC<1.5, VIP<1). (E) The important lipids prioritized by xgboost analysis. (F) The heatmap of 21 differentially expressed lipids in SD vs MD. (G) Receiver operating characteristic (ROC) and performance of the xgboost model in the training set. (H) the raw intensity of 6 keto-PGF1α and LPC(12:0/0:0).

