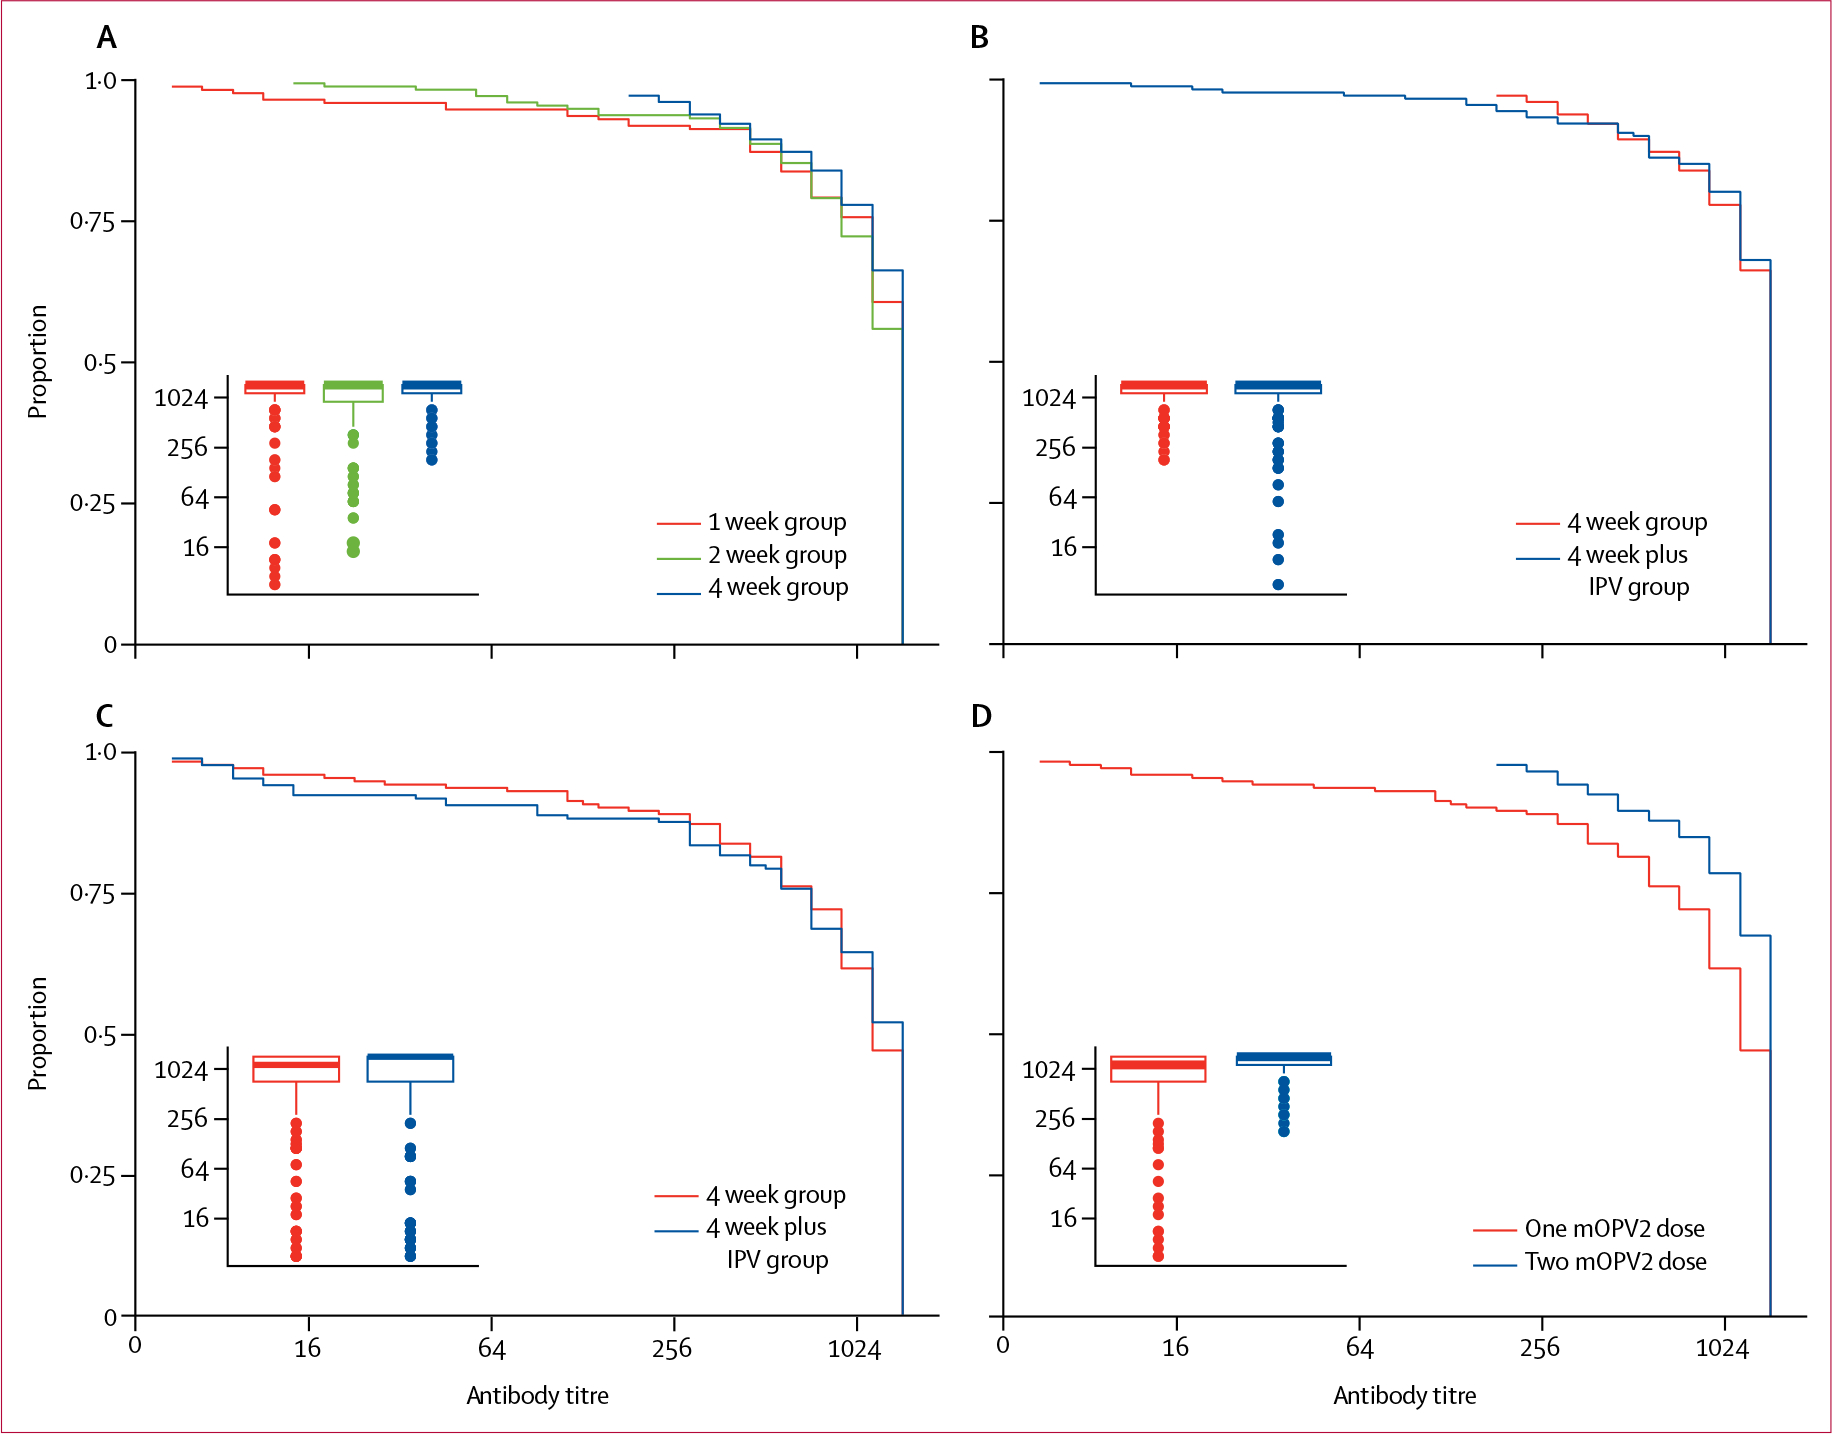
Figure 2: Reverse cumulative distribution and boxplot of poliovirus type 2 titres following varying schedules of mOPV2 with or without IPV.

(A) Titres following two doses of mOPV2 given at a 1 week or 2 week interval versus a standard 4 week interval. Inset of boxplot compares median and IQR of type 2 titres. (B) Titres following two doses of mOPV2 (4 week group) versus two doses of mOPV2 with one IPV dose (4 week plus IPV group). Inset of boxplot compares median and IQR of type 2 titres. (C) Titres following one dose of mOPV2 (4 week group) versus one dose of mOPV2 with one IPV dose (4 week plus IPV group). Inset of boxplot compares median and IQR of type 2 titres. (D) Titres following one dose of mOPV2 versus following two doses of mOPV2 administered at a 4 week interval in the same participants (4 week group). Inset of boxplot compares median and IQR of type 2 titres. y axes show proportion of participants with antibody titres equal to or greater than that represented on the x axis. mOPV2=monovalent oral poliovirus vaccine type 2.
