FIGURE 4.

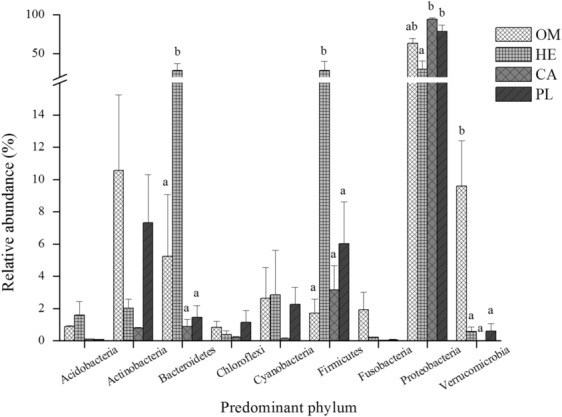
Abundance of fish intestinal dominant flora at phylum level for the four fishes studied. Different letters at each phylum indicate statistical difference (p < .05).

Abundance of fish intestinal dominant flora at phylum level for the four fishes studied. Different letters at each phylum indicate statistical difference (p < .05).