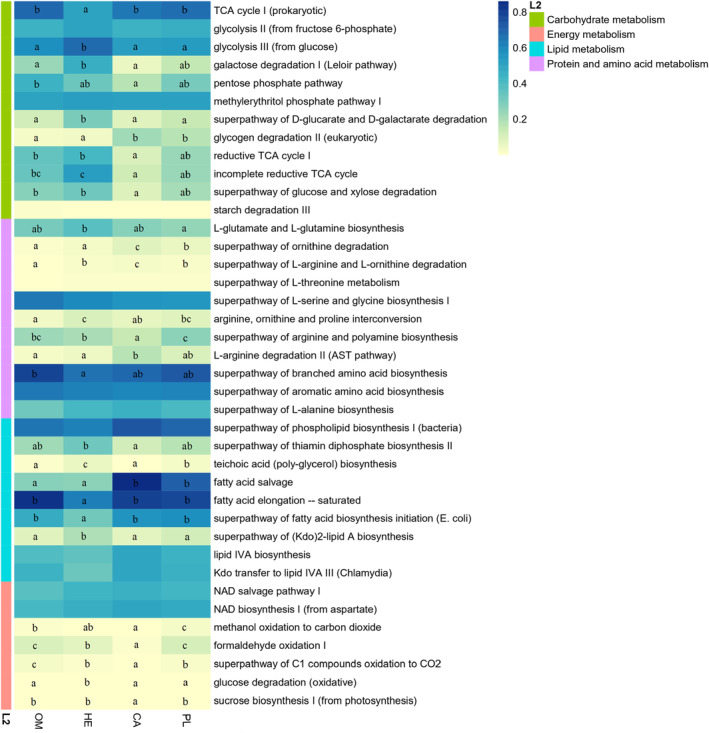
FIGURE 6.

Heatmap presenting the abundance of digestion‐related bacterial gene functions among the four fishes studied with different feeding habits. Samples marked with different letters indicate significant differences (p < .05) among the four fish species studied with different feeding habits.
