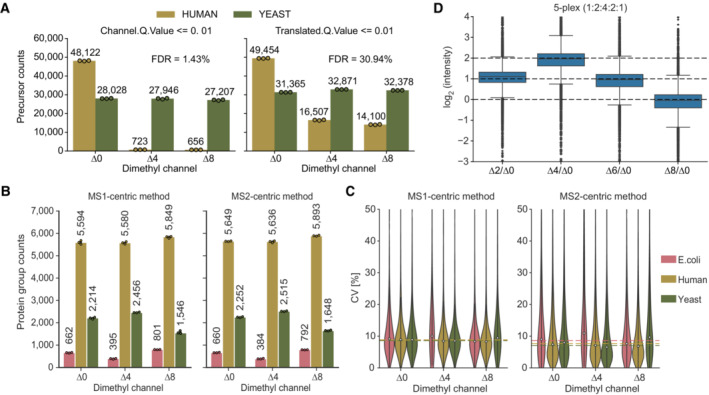
Figure EV1. Identification rates and coefficient of variation (CVs) in the mixed species experiment.

- Determination of the empirical FDR based on filter cut‐offs of ‘Channel.Q.Value’ ≤ 0.01 (left panel) and ‘Translated.Q.Value’ ≤ 0.01 (right panel). All channels contain 100 ng of labeled tryptic yeast peptides. Additionally, channel ∆0 contains 100 ng labeled tryptic HeLa peptides (human) (technical replicates, n = 3).
- Tryptic peptides from E. coli, yeast and human were combined at defined ratios before dimethyl labeling. Side‐by‐side comparison of the number of quantified protein groups for the individual species with MS1‐ and the MS2‐centric methods. 100 ng of peptides were injected per channel (technical replicates, n = 3).
- Coefficients of variation (CVs, %) of protein groups shown in (A). Median CVs for three technical replicates (n = 3) are shown as dashed lines.
- Quantification accuracy assessment of 5‐plex by Lys‐N of labeled HeLa peptides in the respective channel (∆0, ∆2, ∆4, ∆6, ∆8) in a ratio of 1:2:4:2:1 (technical replicates, n = 3). Protein group ratios are plotted as boxplots with expected ratios as dashed lines normalized to the ∆0 channel. The box shows the interquartile range with the central band representing the median value of the dataset. The whiskers represent the furthest datapoint within 1.5 times the interquartile range (IQR).
