
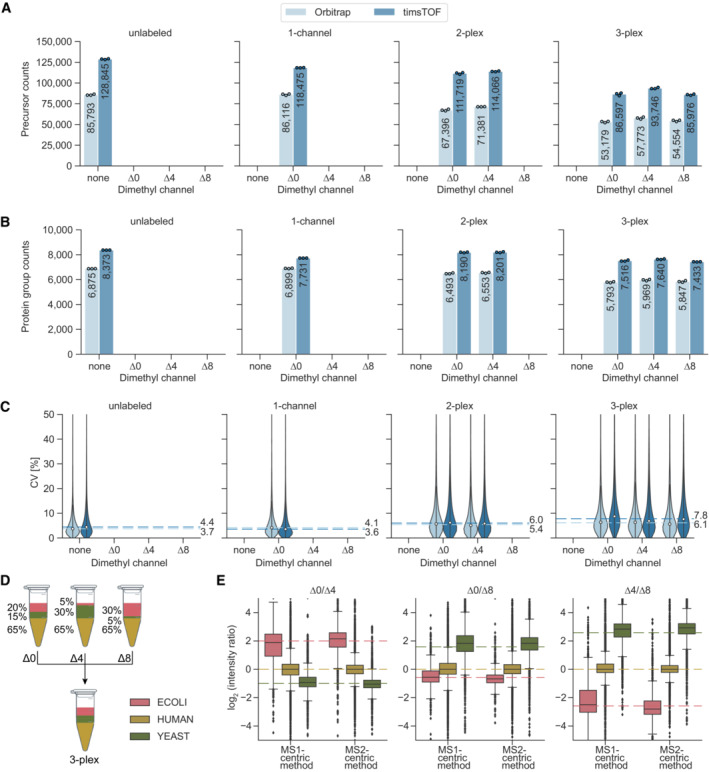
Figure 2. Identification rates, quantification precision and accuracy of dimethyl labeled peptides.
-
A, BNumber of quantified HeLa peptide precursors (A) and protein groups (B) for unlabeled, one‐channel (Δ0), two‐plex (Δ0 and Δ4), and three‐plex (Δ0, Δ4, and Δ8) labeled samples. 125 ng of peptides were injected three technical replicates (n = 3) per channel.
-
CCoefficients of variation (CV, %) of all protein groups identified per condition for Orbitrap and timsTOF instruments. Protein group intensities were calculated using MaxLFQ‐based protein quantification from ‘Precursor.Normalised’ quantities. Median CVs for three technical replicates (n = 3) are shown as dashed lines.
-
DMixing scheme for tryptic peptides of HeLa, S. cerevisiae, and E. coli at different ratios prior to dimethyl labeling. The three channels were multiplexed in a 1:1:1 ratio and 450 ng total amount (150 ng per channel) was measured in three technical replicates (n = 3) on the timsTOF platform using MS1‐ and MS2‐centric methods (Appendix Fig S3A and B).
-
ESide‐by‐side comparison of quantification accuracies between MS1‐centric and MS2‐centric acquisition methods in a mixed species experiment (technical replicates, n = 3). Protein group ratios are plotted as boxplots with expected ratios (dashed lines). The box depicts the interquartile range with the central band representing the median value of the dataset. The whiskers represent the furthest datapoint that is within 1.5 times the interquartile range (IQR).