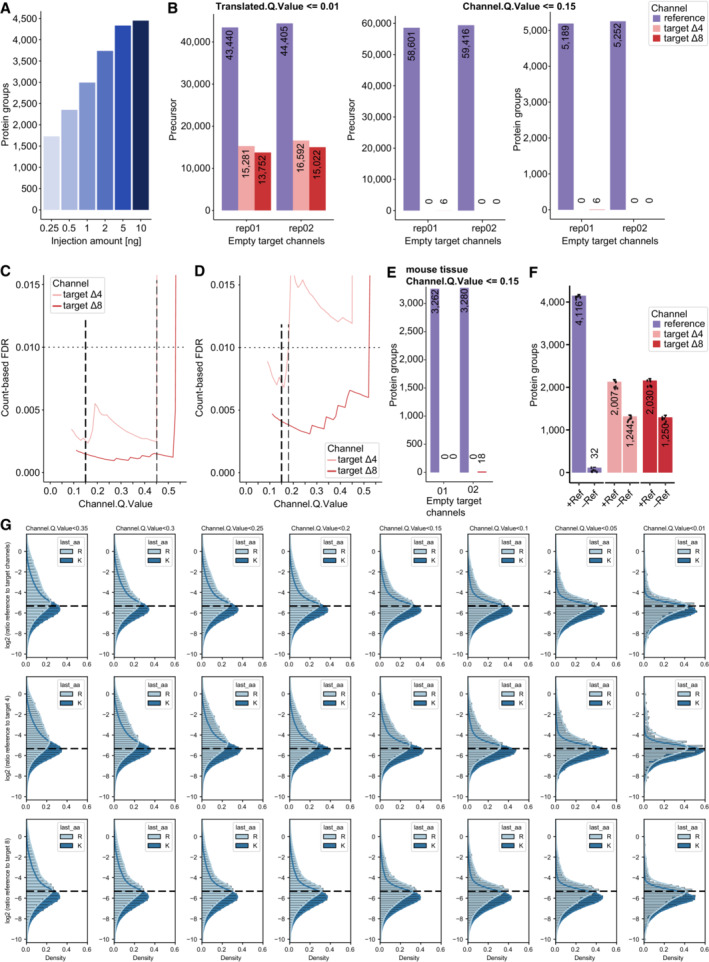
Figure EV3. Evaluation of ‘Translated.Q.Value’ and ‘Channel.Q.Value’ on identifications in empty target channels and quantification in single‐cell equivalents.

-
ADilution series of HeLa peptides to define protein identifications in mDIA workflow, in which the linear increase with input amount levels off at about 10 ng (technical replicates, n = 3).
-
BPrecursor identifications of empty target channels at 1% ‘Translated.Q.Value’ revealed more than 1% false positives (left). Precursor (middle) and protein (right) identifications of empty target channels at 15% Channel.Q.Value showed a FDR lower than 1% (scDecoy dataset).
-
C, DCount‐based FDR estimation on precursor (C) and protein level (D) by dividing two quantities, namely the maximum number of identified precursors or proteins in four empty target channel runs by the minimum number of identified precursors or proteins in a total of four target channels (target channel ∆4 and ∆8) which contain single‐cell equivalent amounts (scDecoy). The count‐based FDR reveals a ‘Channel.Q.Value’ filter of 0.45 for precursors and 0.17 (dashed line) for proteins at 1%. For comparison, the used ‘Channel.Q.Value’ cutoff of 0.15 is shown as well (thick dashed line).
-
EPrecursor count‐based FDR derived from empty target channels with mouse liver tissue samples at 15% Channel.Q.Value is much below 1%.
-
FImpact of the reference channel on identification in the target channels of single‐cell equivalents. We compare single‐cell equivalents in the target channels with (10 ng ∆0‐labeled HeLa) and without reference channel (10 ng unlabeled HeLa) (technical replicates, n = 6). Bars and errors depict median ± standard deviation.
-
GQuantification evaluation of ‘Channel.Q.Value’ filter. Ratios of reference to target channels (top), channel 4 (middle) and 8 (bottom) by RefQuant (Fig 5) are shown for arginine and lysine precursor at a given filter of ‘Channel.Q.Value’ (technical replicates, n = 5). At all filtering steps, the modes of the distributions are close to the expected ratio (dashed line) with a systematic skew towards lower ratios, which is more pronounced for the arginine precursors. The skews in the distributions are decreased with increased filtering stringency in a gradual manner. The mean quantification ratios are as expected, whereas they start to deviate at 0.2.
