
Figure 5. RefQuant quantifies single‐cell equivalents accurately based on sampling ratios relative to the reference channel.
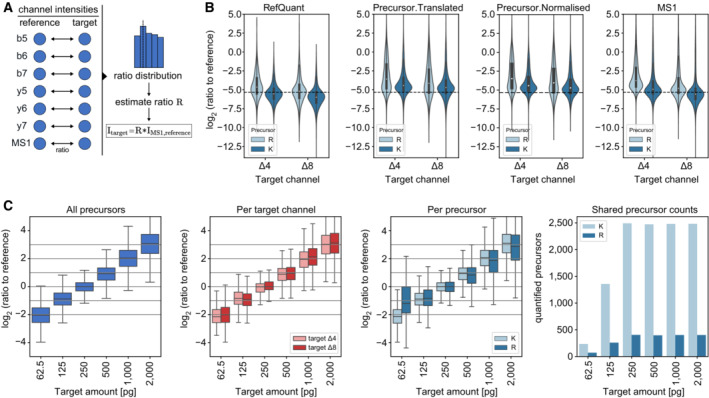
- Concept of RefQuant in calculating ratios between each fragment and MS1 peak for each precursor between reference and each target channel. The resulting ratio distribution is filtered for the first 40% of the quantile and the ratio factor R is calculated by the mean of the resulting distribution. This ratio factor R is then multiplied by the reference intensity to retrieve the RefQuant target intensity.
- Ratio of reference channel to each target channel by arginine (R) and lysine (K) precursor based on quantities from RefQuant (left), ‘Precursor.Translated’ and ‘Precursor.Normalised’ by DIA‐NN (middle) and MS1 by DIA‐NN (right) on the scBenchmark dataset (technical replicates, n = 5). RefQuant showed best the expected ratios in both target channels compared to DIA‐NN quantities. The violin plot shows the distribution of the data while the box depicts the interquartile range with the central band representing the median value of the dataset. The whiskers represent the furthest datapoint within 1.5 times the interquartile range (IQR).
- RefQuant accurately quantified four‐fold differences in protein amount between reference and target channels (scQuant dataset, 62.5 to 2000 pg in target channel, 10 ng in reference channel) and correctly extracted the expected ratios across channels for lysine (K) and arginine (R) precursors (technical replicates, n = 5). The ratio of reference to target channel was calculated using RefQuant. All log2 ratios were normalized to the single‐cell equivalent sample in the target channel (250 pg) and only shared precursors are used (right panel). The box depicts the interquartile range with the central band representing the median value of the dataset. The whiskers represent the furthest datapoint within 1.5 times the interquartile range (IQR).
Source data are available online for this figure.