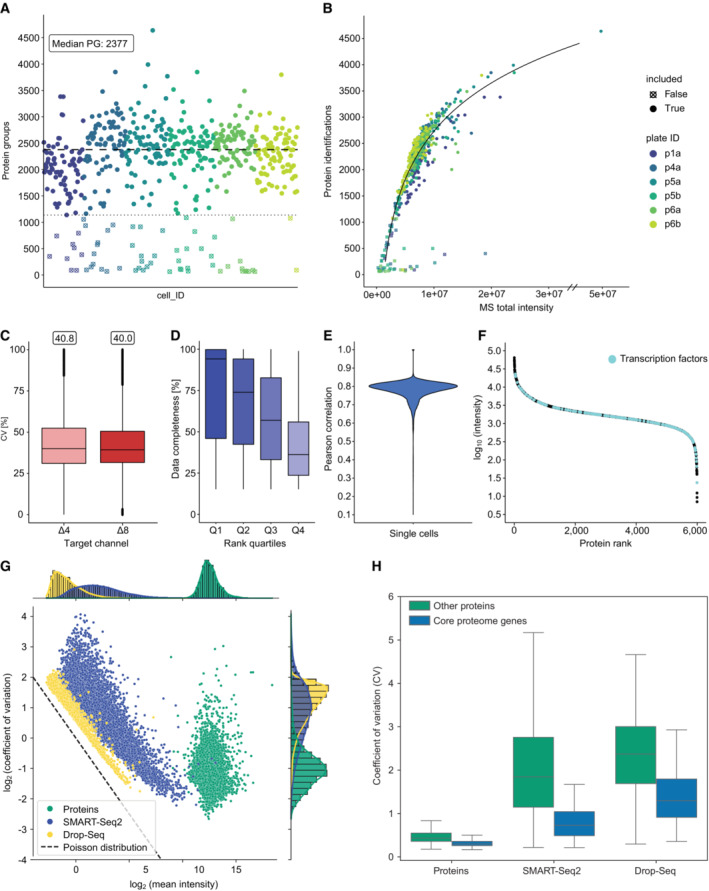
Figure 6. Reference channel doubles protein identifications per single cell and the concept of a stable proteome is still valid.

- Protein identifications of single‐cell measurements. Four hundred and seventy‐six single HeLa cells reveal a median identification of 2,377 with few single cells of identifications up to 4,000 protein groups over six 384‐well plates (disregarding a single outlier of 4,600 protein groups).
- Protein identifications versus the total sum of MS signal intensity per cell measurement shows a logarithmic dependency.
- CV distribution of single cells in each target channel (biological replicates, n = 476). The box depicts the interquartile range with the central band representing the median value of the dataset. The whiskers represent the furthest datapoint within 1.5 times the interquartile range (IQR).
- Completeness of ranked quartiles (Q1: 1–924; Q2: 925–1,848; Q3: 1,849–2,772; Q4: 2,773–3,696). Proteins with high rank show higher data completeness compared to low ranked proteins (biological replicates, n = 476). The box depicts the interquartile range with the central band representing the median value of the dataset. The whiskers represent the furthest datapoint within 1.5 times the interquartile range (IQR).
- Pearson correlation of single cells of the mDIA workflow (median 0.79).
- Rank plot of close to 6,000 proteins. Transcription factors are highlighted across abundance range (cyan).
- Coefficients of variation of single‐cell mDIA protein expression plotted against the mean intensity of each protein for single‐cell proteins (green) and scRNAseq of SMART‐Seq2 (blue) and Drop‐Seq (yellow).
- Comparison of coefficients of variation between single‐cell proteomics and scRNAseq with regards to the ‘core proteome’ (blue) and other genes (green) (biological replicates, scProteomics n = 476, SMART‐Seq2 n = 720, Drop‐seq n = 5,665). The box depicts the interquartile range with the central band representing the median value of the dataset. The whiskers represent the furthest datapoint within 1.5 times the interquartile range (IQR).
Source data are available online for this figure.
