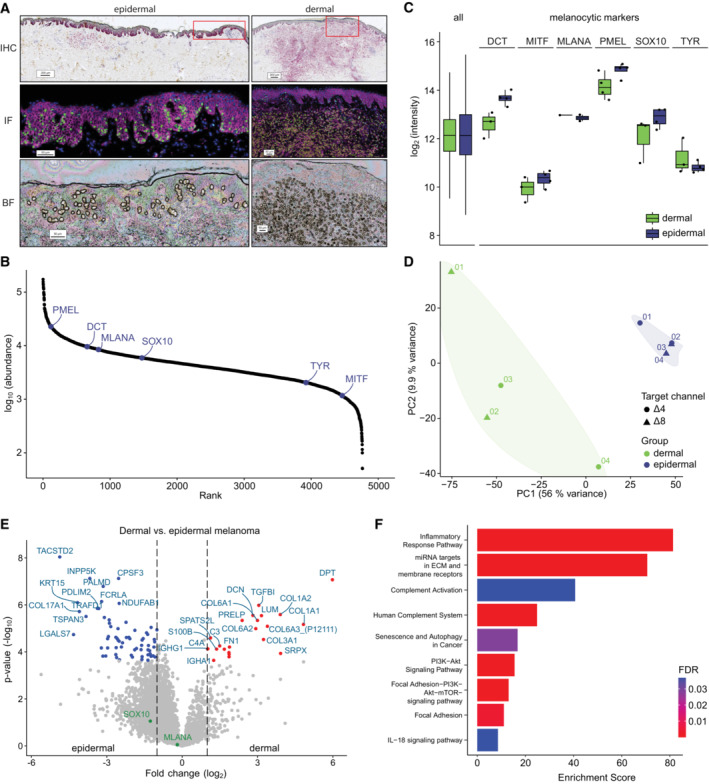
Figure 7. mDIA‐DVP applied to primary cutaneous melanoma showcases its potential for precision oncology.

- Macroscopic overview of primary cutaneous melanoma (type SSM, Breslow 3.5 mm) including Melan‐A immunohistochemistry (IHC, pink) and CD44/Sox10 immunofluorescence (IF, pink/green), as well as a brightfield (BF) image after laser microdissection. Segmented melanoma cells are highlighted (yellow outlines). Quadruplicates of 100 shapes (20 cell equivalents) were laser‐microdissected from the epidermal (left) and dermal (right) compartment using Deep Visual Proteomics (DVP).
- Rank plot of all proteins identified in melanoma cells. Six out of seven melanocyte identity markers were identified (blue).
- Boxplot of log2 intensities of all proteins compared to six out of seven identified melanocytic markers (Belote et al, 2021) (biological replicate, n = 4 in each group). The box depicts the interquartile range with the central band representing the median value of the dataset. The whiskers represent the furthest datapoint within 1.5 times the interquartile range (IQR).
- Principal component analysis of dermal and epidermal melanoma cells which differentiate on PC1 irrelevant of the target channel used.
- Differential protein expression between epidermal (left) and dermal (right) melanoma cells. Significant proteins (Benjamini–Hochberg corrected multiple‐sample t‐test, q‐val/FDR < 0.01) with a log2 fold change > 1 (red) and < 1 (blue) are highlighed, respectively.
- Overrepresentation analysis of significantly enriched proteins in dermal melanoma using the Wikipathway database. Color represents FDR (threshold < 0.05).
