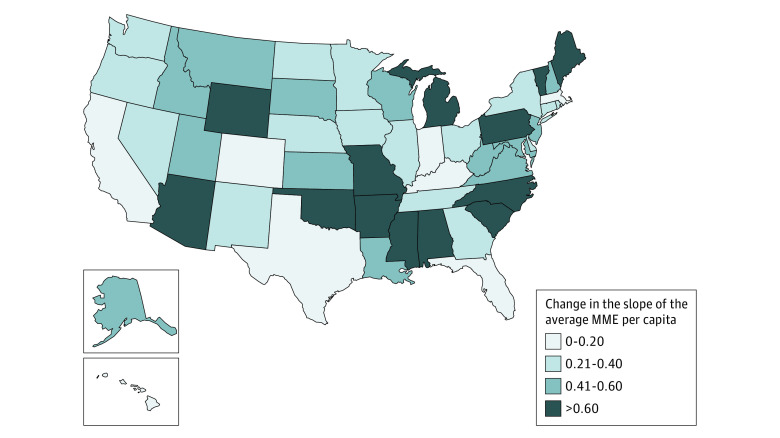
Figure 5. Estimated State-Level Change of the Mean Morphine Milligram Equivalents (MME) per Capita Slope Following the 2016 CDC Guideline Release.
States are colored relative to the magnitude of estimated mean MME per capita slope changes from the preguideline to the postguideline period. Darker colors correspond to larger changes (preguideline slope – postguideline slope) in the slope. Changes were not statistically significant for Florida.

