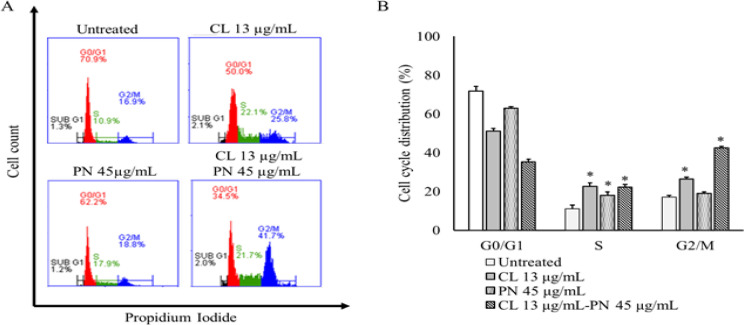
Figure 3.
CL and PN Induced Cell Cycle Arrest on MDAMB-231 Cells. (A) Flow cytometry analysis of percentage cell in each phase of cell cycle for the indicated treatment. (B) Percentage of cell cycle distribution of CL or PN in single and combination treatment for 24 h. The results are presented as the mean ± standard deviation for n = 3, p < 0.05

