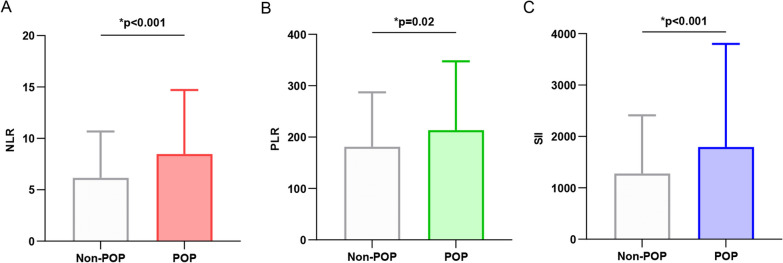
Fig. 1.
The bar graph displays the distribution of NLR, PLR, and SII values between the non-POP group (n = 1008) and the POP group (n = 111). a The NLR values in the POP group were higher than in the non-POP group (p < 0.001). b The PLR values in the POP group were higher than in the non-POP group (p = 0.02). c The SII values in the POP group were higher than in the non-POP group (p < 0.001). NLR refers to neutrophil-to-lymphocyte ratio; PLR refers to platelet-to-lymphocyte ratio; SII refers to systemic immune-inflammation index; POP refers to postoperative pneumonia; Non-POP refers to non-postoperative pneumonia

