Fig. 4.
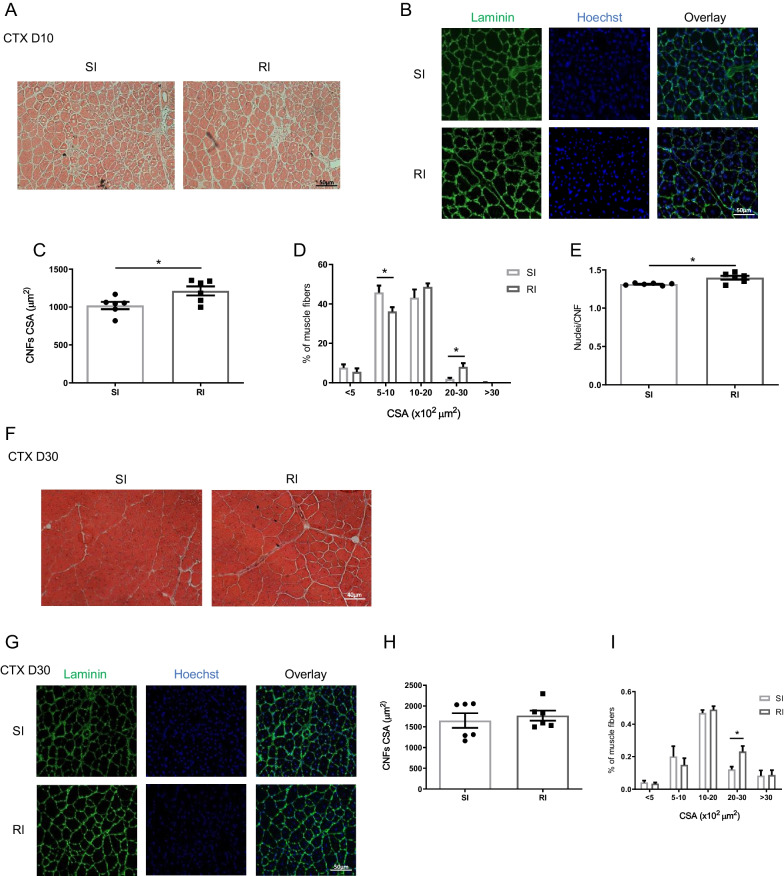
Accelerated muscle regeneration after repeated cardiotoxin injury: A and B Representative images of centrally nucleated regenerating fibers (CNFs), evidenced by H&E (A) or laminin staining (B), in muscle sections, 10 days after single or repeated cardiotoxin injury. C and D Quantification of the mean cross-sectional area (CSA) of the CNFs, expressed in square microns, and quantification of the distribution of CNFs per CSA, expressed in percentage. E Quantification of the number of nuclei per CNF in muscle sections. F and G Representative images of CNFs, evidenced by H&E (F) or laminin staining (G), in muscle sections, 30 days after single or repeated cardiotoxin injury. H and I Quantification of mean CSA of the CNFs, expressed in square microns, and quantification of the distribution of CNF per CSA, expressed in percentage. n = 6 independent samples. Data are shown as mean ± S.E.M. *p < 0.05

