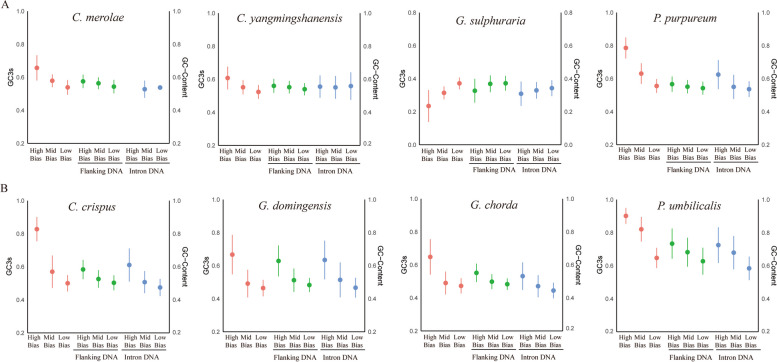
Fig. 2.
Comparison of the average GC3s for coding sequences and GC content for noncoding DNA in red algae. The line chart represents the standard deviation of each category value. Red dots represent the value of GC3s shown on the left y-axis (from left to right: high-bias genes, mid-bias genes and low-bias genes). The GC of noncoding is displayed on the right y-axis (flanking DNA: green dots; intron DNA: blue dots. From left to right: high-bias genes, mid-bias genes and low-bias genes). A: unicellular red algal group; B: multicellular red algal group

