
Figure 5.
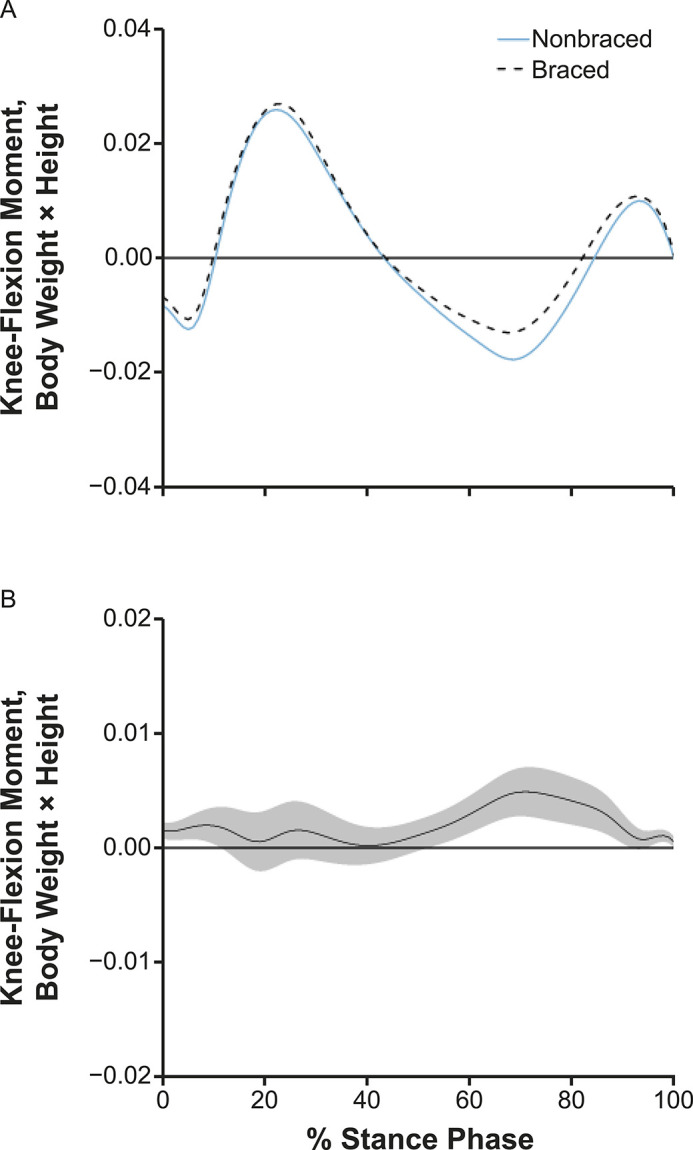
A, Internal knee-flexion moments and, B, mean difference curve of the braced and nonbraced conditions. A, Mean ensemble waveforms plotted over the stance phase of walking for mean internal knee-flexion moment for both the braced and nonbraced conditions. B, Corresponding pairwise comparison functions and associated 95% CIs (gray bands) indicating the mean differences between the braced and nonbraced conditions. Differences between conditions exist when the 95% CIs do not overlap zero.