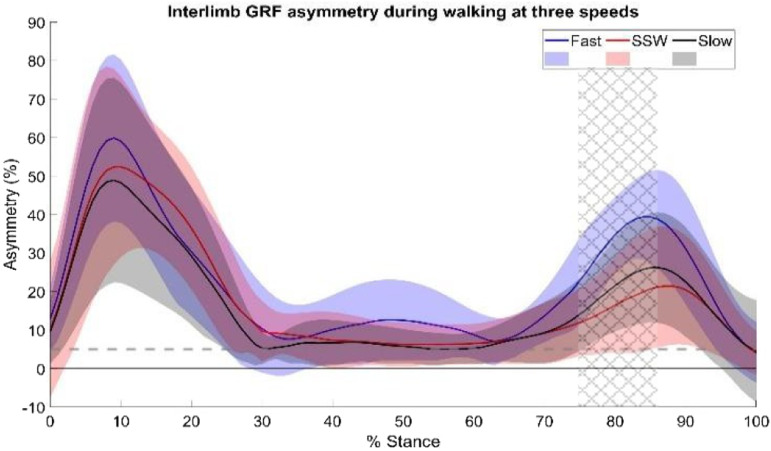
Figure 1.
Average interlimb GRF asymmetry and standard deviation during stance for three walking speeds (Fast, Preferred, Slow). The gray dotted line represents the asymmetry threshold such that a value greater than 5% is considered asymmetric. Statistical differences were found in the cross-hatched region.

