Fig. 3.
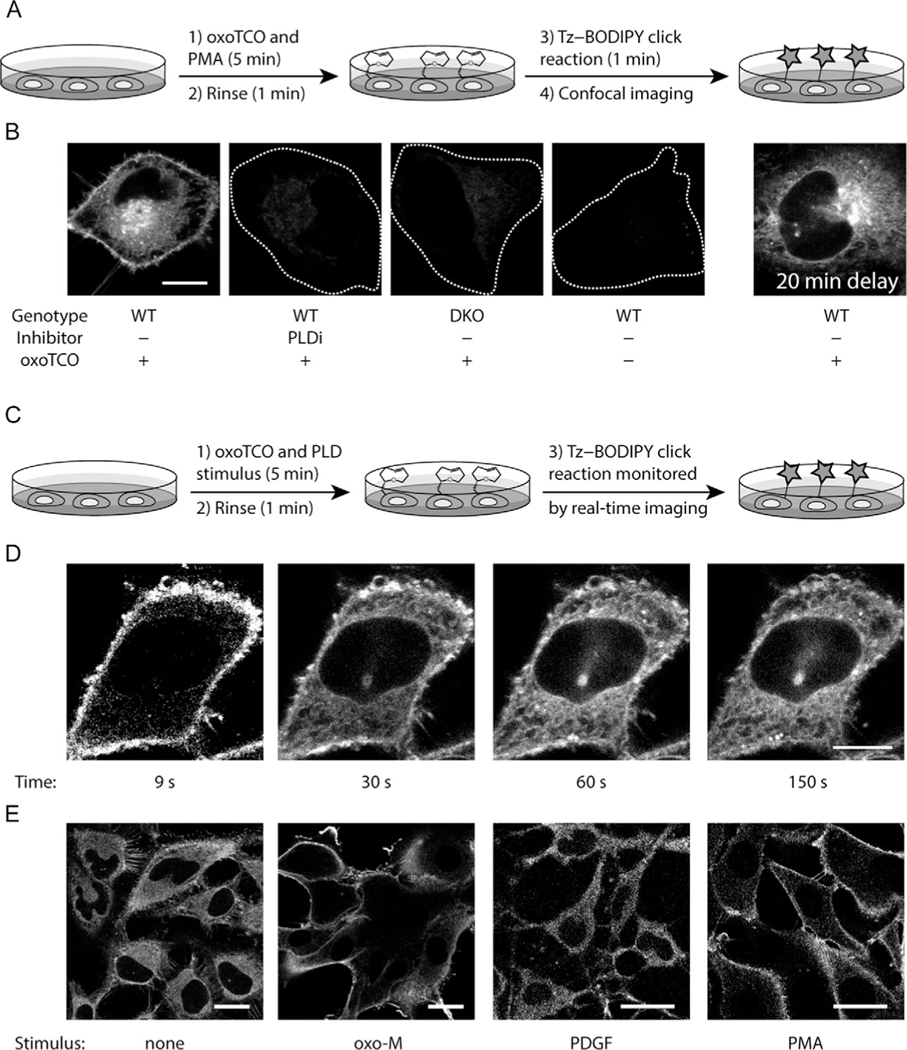
Overview of RT-IMPACT with oxoTCO and IEDDA detection. (A) Schematic of steady-state imaging of PLD activities using oxoTCO as a substrate and Tz-BODIPY as the fluorogenic reporter (see Section 3.2). HeLa cells are stimulated (e.g., with PMA (100 nM)) in the presence of oxoTCO (3 mM) for 5 min, rinsed (1 min), and click chemistry tagging is performed via IEDDA with Tz-BODIPY (0.5 μM for 1 min). (B) Representative images using the protocol in (A), with indicated negative controls. White dotted lines represent cell outline in negative control cells. WT: Wild-type; DKO: PLD1/2 double knockout cells. PLDi: PLD inhibitor (FIPI, 750 nM pre-incubation for 30 min prior to and during oxoTCO/PMA stimulation step). 20 min delay refers to cells labeled as in the left-most panel but imaged after a 20-min incubation at 37 °C. Note redistribution of fluorescent lipids from PM to intracellular membranes on this timescale. Scale bar: 10 μm. (C) Schematic of real-time imaging of PLD activity using RT-IMPACT (see Section 3.3). Cells are first stimulated with a PLD stimulus either alone (optional) or together with oxoTCO (3 mM) for 5 min at 37 °C, rinsed (1 min), and imaged in real-time (snapshots taken every 3 s for a 3-min period) before and after addition of Tz-BODIPY (0.5 μM final concentration). (D) RT-IMPACT reveals lipid-trafficking events of fluorophore-tagged lipid reporters. Images shown are snapshots acquired at the indicated timepoints post-addition of Tz-BODIPY using the protocol in (C) and are adjusted to a similar brightness to facilitate viewing the localizations of fluorescent signals. Scale bar: 10 μm. (E) RT-IMPACT reveals stimulus-specific subcellular localizations of PLD activities. Representative images of indicated stimuli were acquired using the protocol described in (C). Images shown are snapshots at 9 s timepoints after addition of Tz-BODIPY and adjusted to similar brightness to facilitate visual assessment. HeLa cells stably expressing M1 muscarinic receptor (M1R) were used for the no stimulus (none) and oxotremorine-M (oxo-M, an M1R agonist) conditions, whereas NIH 3T3 cells were used for stimulation with platelet-derived growth factor (PDGF) and PMA. Scale bars: 20 μm. Note that for some stimuli, the most elevated PLD activity requires a stimulation with agonist prior to the agonist+ oxoTCO step. I.e., here, oxo-M (10 μM) was added to the cells simultaneously with oxoTCO, but PDGF (50 ng/mL) and PMA (100 nM) were added to cells 10 min before incubation together with oxoTCO.

