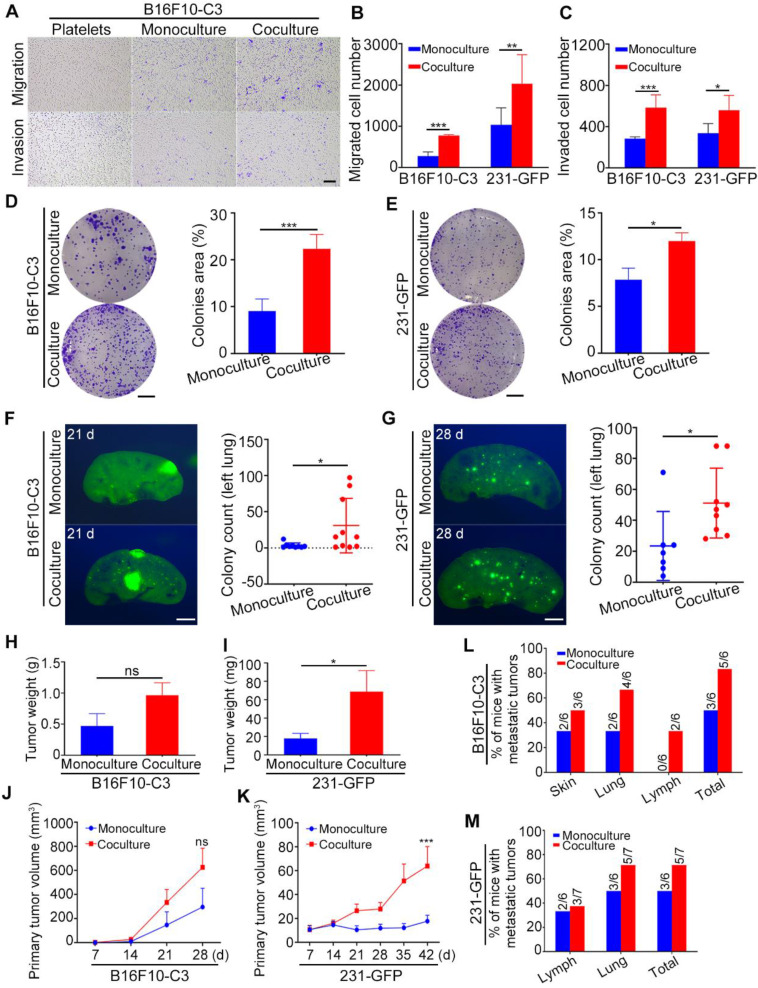
Figure 2.
Cocultured cancer cells showed increased migration, invasion, colony formation, tumorigenic and metastatic capacities. (A) Transwell migration and invasion assays for platelets and monocultured and cocultured B16F10-C3 cells. Scale bar, 200 μm. (B and C) Quantification of the migrated and invaded B16F10-C3 and 231-GFP cells in the monocultured and cocultured groups. (D and E) Images and quantification of the colony formation assays for the monocultured and cocultured B16F10-C3 and 231-GFP cells. Scale bar, 5 mm. (F and G) Two hundred and fifty thousand B16F10-C3 cells or half a million 231-GFP cells in the monocultured and cocultured groups were tail-vein injected into C57BL/6J (n = 9 to 10) and nude mice (n = 7 to 9), respectively. Mice were sacrificed 21 days or 28 days post injection. Colonies formed in the left lungs were counted, and representative images are shown. Scale bar, 1 mm. (H and I) The primary tumor weights in the monocultured and cocultured B16F10-C3 and 231-GFP cells using the orthotopic models. (J and K) The quantified results for primary tumor volume. (L and M) Quantification % of mice with metastatic tumors. The results are shown as the mean ± SD, except for the data of tumor weight and tumor volumes, which are mean ± SEM. *P < 0.05, **P < 0.01, ***P < 0.001 and ns indicates no significance.

