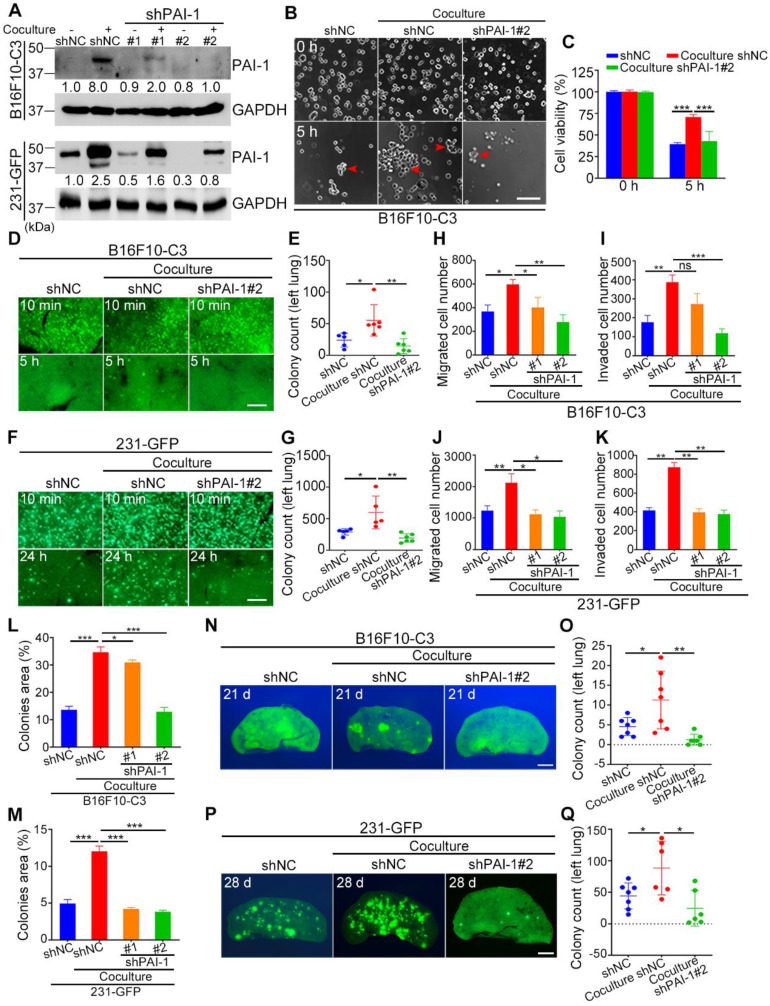
Figure 4.
Knockdown of PAI-1 effectively reduced the survival and metastatic potential of B16F10-C3 and 231-GFP cells. (A) Western blotting results showing the protein levels of PAI-1 after knocking down PAI-1 with shRNAs. (B and C) Representative phase contrast images and quantified results of cell viability of B16F10-C3 cells for 5 h under SS15 after knockdown of PAI-1. Scale bar, 100 μm. (D to G) Fluorescent images and quantification of cell survival in circulation in vivo after knocking down PAI-1 in B16F10-C3 and 231-GFP cells 5 h and 24 h post injection through the tail vein in C57BL/6J (n = 5 to 6) and nude mice (n = 5 to 6), respectively. Scale bar, 1 mm. (H to K) Quantified results of the Transwell migration and invasion assays for monocultured shNC, cocultured shNC, cocultured shPAI-1#1 and shPAI-1#2 B16F10-C3 and 231-GFP cells. (L and M) Quantified results of the colony formation assay for monocultured shNC, cocultured shNC, cocultured shPAI-1#1 and shPAI-1#2 B16F10-C3 and 231-GFP cells. (N to Q) Fluorescent images and colony count after knocking down PAI-1 in B16F10-C3 cells at 21 days in C57BL/6J mice (n = 7) and 231-GFP cells at 28 days in nude mice (n = 6 to 7) post injection through the tail vein, respectively. Scale bar, 1 mm. The results are shown as the mean ± SD. *P < 0.05, **P < 0.01, ***P < 0.001 and ns, no significance.

