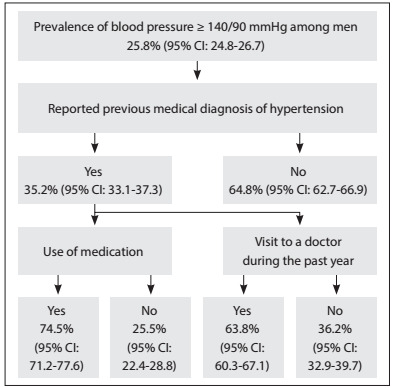
Figure 2: Flow diagram for the male population with blood pressure ≥ 140/90 mmHg, according to previous medical diagnosis, use of medication and consultations with a doctor during the past year, in the National Health Survey (Pesquisa Nacional de Saúde, PNS), 2013.