


Table 2. Anthropometric characteristics of the sample (mean ± SD).
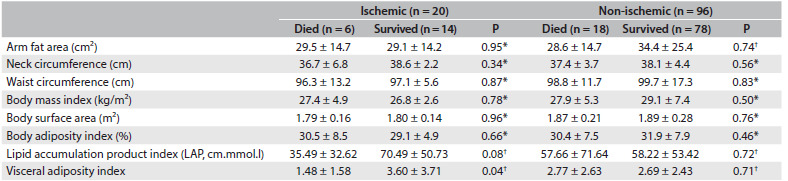
SD = standard deviation. *Student’s t test (parametric variables), taking P < 0.05 (5%) to be significant; †Wilcoxon and Mann-Whitney tests (nonparametric variables) for comparison, taking P < 0.05 (5%) to be significant.