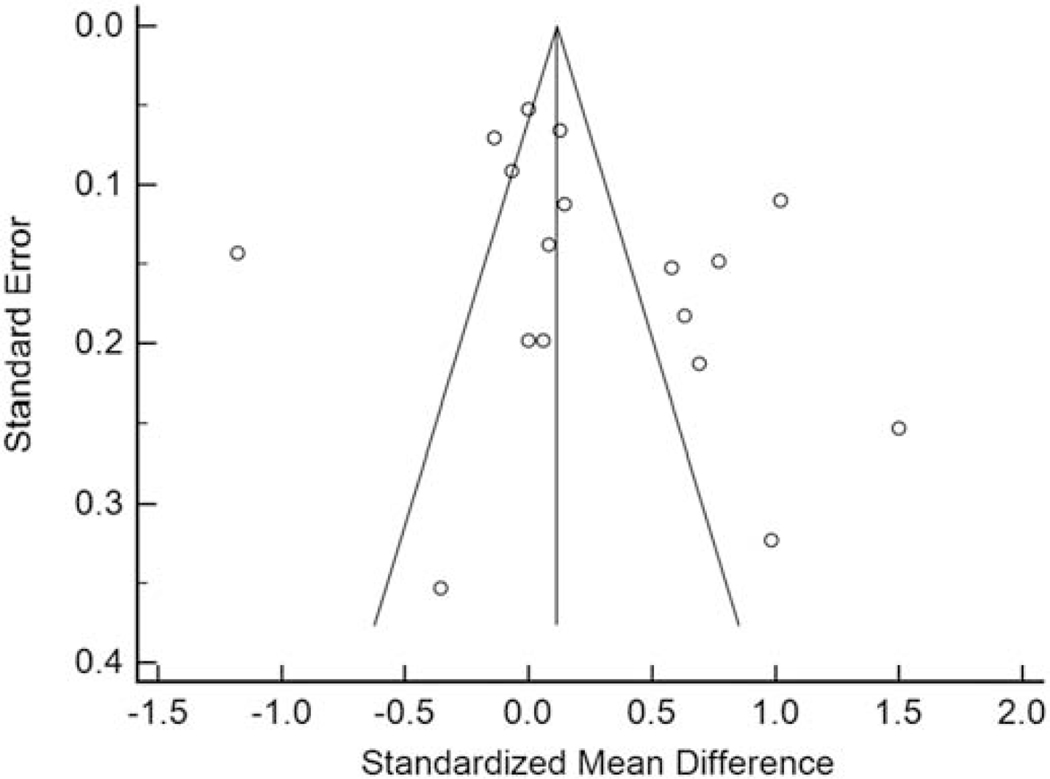
Figure 2.
Funnel plot for the mean differences vs. standard errors in carotid intima-media thickness (mm) in HIV-infected and uninfected groups among cross-sectional studies. Funnel plot demonstrated asymmetry with 9 studies to the right of the combined effect size and 8 studies to the left. Egger’s regression indicated the presence of publication bias (intercept=5.28467, 95% CI: 1.97 to 8.59, t=3.39, P=0.00198).

