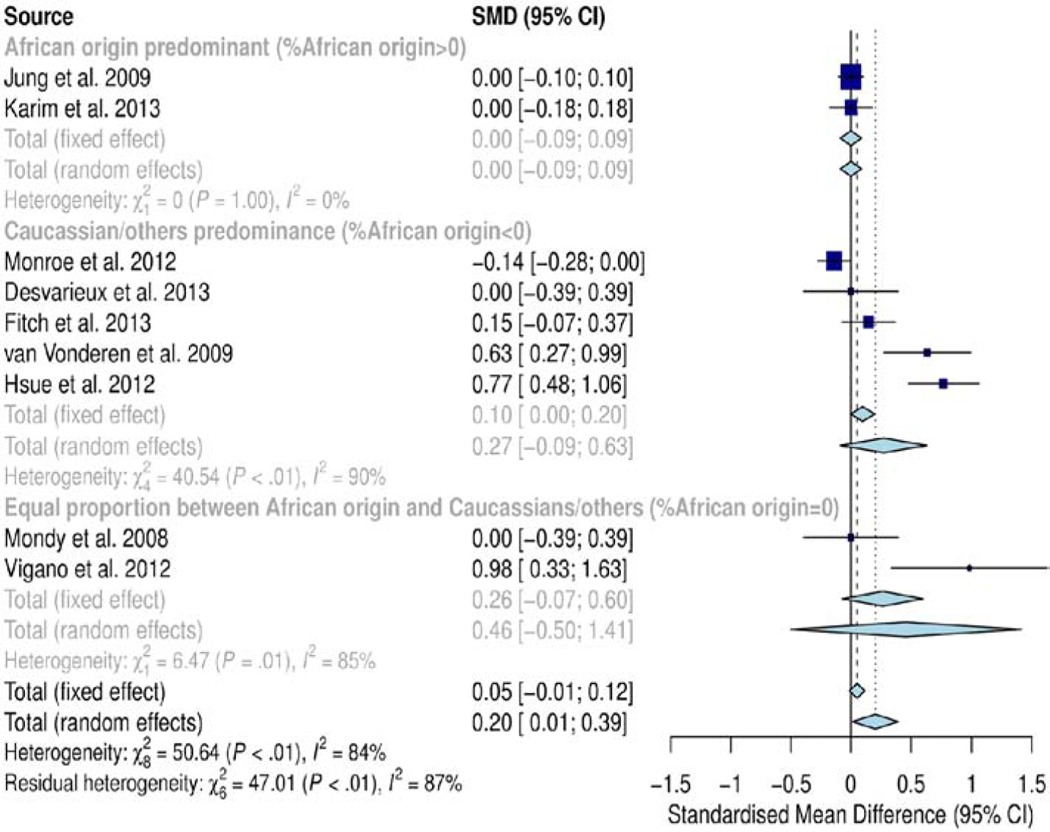
Figure 5.
Forest plot for race/ethnicity. Subgroup analysis by ethnicity/race showed significant difference in SMD of cIMT between subgroups (SMD=0.20mm, CI=0.01, 0.39; p<0.01). The subgroup dominated by individuals of African origin exhibited no significant difference (SMD=0.0mm; p=1.0), the subgroup dominated by Caucasians/others had significantly higher SMD of cIMT (0.27 mm; p<0.01) and the subgroup matched for race (equal proportion) also showed significantly higher SMD of cIMT (0.46mm; p<0.01). Overall, heterogeneity in this subgroup analysis was high (I2, 84%; p<0.01).

