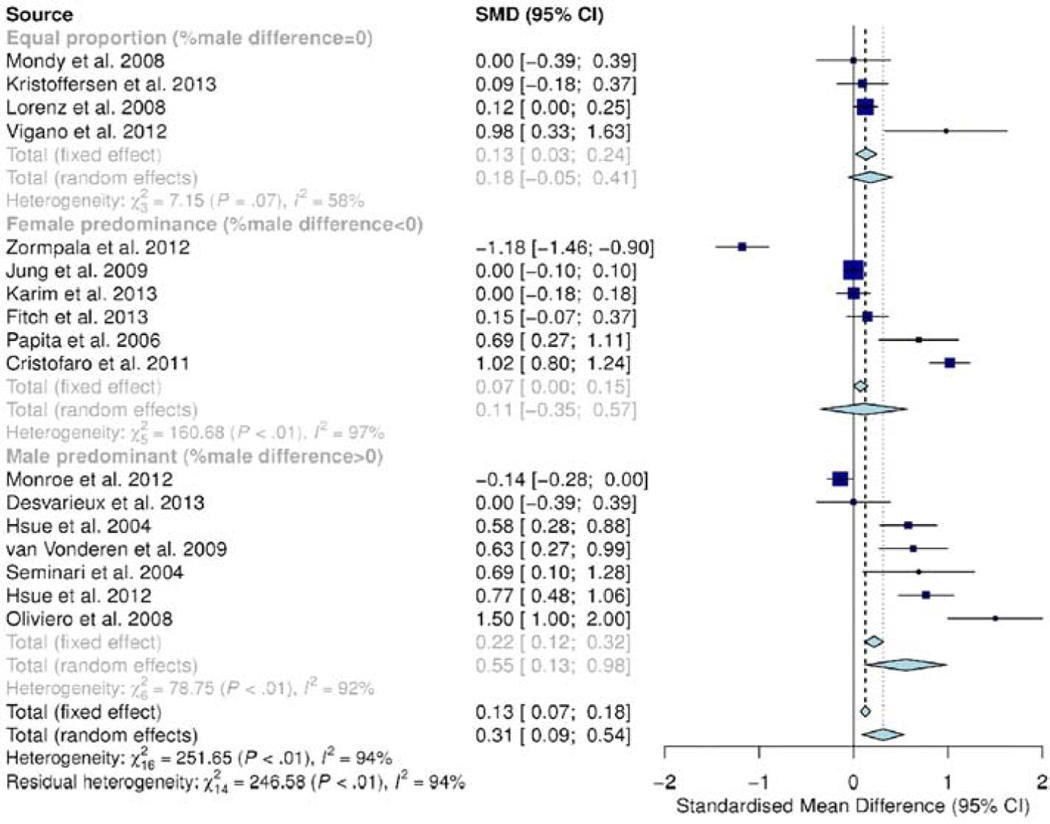
Figure 6.
Subgroup analysis for gender demonstrated statistically significantly subgroup effect (p<0.01) entailing that gender influences cIMT. There was moderate to substantial unexplained heterogeneity between studies in each subgroup (equal gender proportion group: I2 = 58%; male dominated group: I2= 92% and female dominated group: I2 = 97%), meaning that validity of the effect estimate in each subgroup is uncertain.

