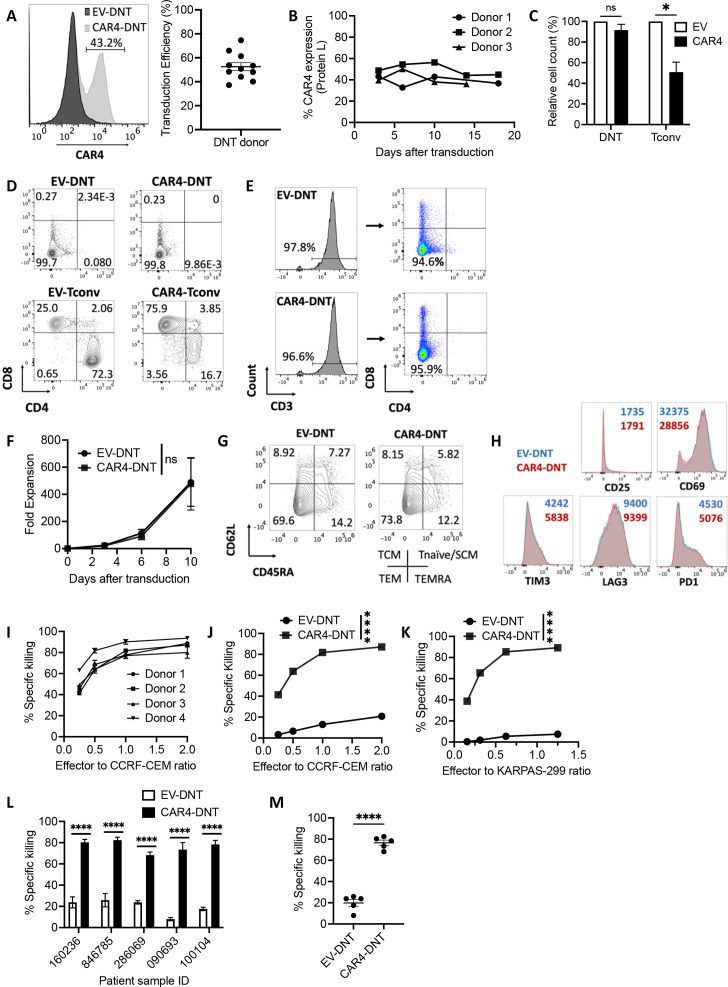
Figure 2.
CAR4-DNTs are able to target CD4+ T-ALL and PTCL in vitro. (A) Donor-derived DNTs were transduced with a retroviral vector expressing CAR4 or an EV control. Three days after transduction, the expression of CAR4 on DNTs was measured by protein L. Left: Representative histogram showing the protein L staining on EV-DNTs (black) and CAR4-DNTs (gray). Right: Summary of CAR4 expression level on CAR4-DNTs from 11 independent experiments. Each dot represents transduction efficiency of DNTs from an individual donor. Horizontal line represents the mean, and error bars represent SEM. (B) Expression of CAR4 measured on DNTs over the course of 18 days after transduction (n=3) from three independent experiments. (C–D) DNTs and Tconv derived from the same donors (n=3) were transduced with EV and CAR4. Four days after transduction, cell counts and expression of CD4 and CD8 on transduced T cells were measured by flow cytometry. (C) Bar graphs showing cell counts of CAR4-DNTs and CAR4-Tconv relative to their EV-transduced counterparts. Error bars represent SEM. Two-way ANOVA Tukey’s multiple comparison test was used for statistical analysis. (D) Representative flow plots showing the frequencies of CD4+ and CD8+ T cells within each transduced T-cell population. (E) Ex vivo expanded EV-DNTs and CAR4-DNTs were stained with anti-CD3, anti-CD4, and anti-CD8 antibodies and analyzed by flow cytometry. Data shown are representative of three independent experiments. (F) EV-DNTs or CAR4-DNTs were expanded for 10 days (n=4) in four independent experiments. Mean fold expansion for EV-DNTs (circles) or CAR4-DNTs (squares). Error bars represent SEM. Two-way ANOVA was used for statistical analysis. (G) Memory status of EV-DNTs (left) and CAR4-DNTs (right) expanded from the same donor on day 10 after transduction. Cells were stained with CD45RA and CD62L. Flow plots are representative of three independent experiments. (H) Expression of activation and exhaustion markers, CD25, CD69, TIM3, LAG3, and PD1, on the surface of EV-DNTs or CAR4-DNTs on day 14 after transduction. Histograms are representative of three independent experiments, and numbers represent mean fluorescence intensity. (I) CAR4-DNTs from four different donors were cocultured with CCRF-CEM for 2 hours at indicated effector-to-target ratios. Per cent specific killing of the target is shown. Symbols represent mean per cent specific killing of triplicates, and error bars represent SD. (J and K) EV-DNTs (circles) or CAR4-DNTs (squares) were cocultured with T-ALL cell line, CCRF-CEM (J), or PTCL cell line, KARPAS-299 (K), for 2 hours at indicated effector-to-target ratios. Per cent specific killing of the target is shown. The experiment was independently performed seven (J) or three (K) times each with triplicates, and representative data are shown. Two-way ANOVA was used for statistical analysis. (L) EV-DNTs (white bars) and CAR4-DNTs (black bars) were cocultured with five primary T-ALL blasts for 2 hours at a 2:1 effector-to-target ratio. Per cent specific killing of T-ALL blasts is shown. Data represent mean per cent specific killing of the target using DNTs obtained from two different donors. Each experiment was done in technical duplicates. Error bars represent SEM. Numbers on the x-axis represent patient sample identifications. Two-way ANOVA Sidak’s multiple comparison test was used for statistical analysis. (M) Comparison of specific killing of the five primary T-ALL samples by EV-DNTs and CAR4-DNTs. Dots represent per cent specific killing, horizontal lines represent the mean, and the error bars represent SEM. Paired t-test was used for statistical analysis. *p<0.05; ***p<0.001; ****p<0.0001. ANOVA, analysis of variance; CAR4, CD4-CAR; DNTs, double-negative T cells; EV, empty-vector; PTCL, peripheral T-cell lymphoma; T-ALL, T-cell acute lymphoblastic leukemia; TCM, central memory T cell; Tconv, conventional T cells; TEM, memory T cells; TEMRA, terminally differentiated effector memory T cells; Tnaïve/SCM, naïve/stem cell memory T cell.

