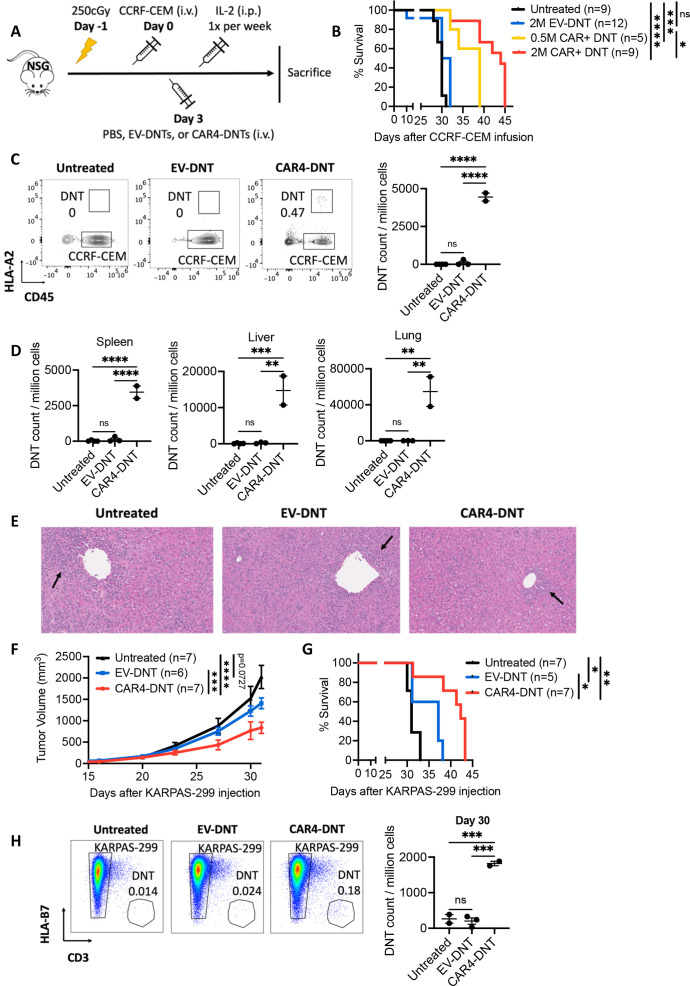
Figure 3.
CAR4-DNTs can target CD4+ T-ALL and PTCL in xenograft models. (A) Schematic outline of in vivo experiments. NSG mice were sublethally irradiated (250 cGy) on day −1 and intravenously (i.v.) injected with 2–5×10⁵ CCRF-CEM cells on day 0. On days 3, mice were i.v. treated with PBS or various dosages of EV-DNTs or CAR4-DNTs. All mice received intraperitoneal (i.p.) injections of IL-2 one time per week. Mice were sacrificed when they reached the end point of the survival experiment. (B) Kaplan-Meier curve showing the per cent survival of CCRF-CEM-engrafted mice treated with PBS (black, n=9), 0.5×10⁶ (yellow, n=5), 2×10⁶ (red, n=9) CAR+ CAR4-DNTs, or 2×10⁶ EV-DNTs (blue, n=12). Data are summary of three independently performed experiments. Log-rank test was used for statistical analysis. (C) CCRF-CEM engrafted mice were sacrificed on day 32 and bone marrow was examined. DNTs were identified via staining with anti-CD45 and anti-HLA-A2 antibody. Left: Representative flow plots for CD45 and HLA-A2 staining of bone marrow cells from untreated, EV-DNT-treated, and CAR4-DNT-treated mice on day 32. CCRF-CEM cells are HLA-A2−; an HLA-A2+ donor was used to manufacture EV-DNTs and CAR4-DNTs. Right: Number of DNTs detected by flow cytometry on day 32. Each dot represents the DNT count per million cells in the bone marrow of one mouse, horizontal line represents the mean, and error bar represents SEM. One-way ANOVA Tukey’s multiple comparison test was used for statistical analysis. (D) Number of DNTs in the spleen, liver, and lungs of CCRF-CEM engrafted mice on day 32 as detected by flow cytometry. Each dot represents the DNT count per million cells in the spleen (left), liver (middle), or lung (right) of one mouse, horizontal line represents the mean, and error bar represents SEM. One-way ANOVA Tukey’s multiple comparison test was used for statistical analysis. (E) Representative images (×20 magnification) of H&E-stained slides of liver sections taken from CCRF-CEM engrafted mice in PBS (left), EV-DNT (middle), or CAR4-DNT (right) treatment group (n=2 per group) at the endpoint of the experiment, showing tissue histology and lymphocytic blast infiltration (black arrow). (F) Tumor volume of KARPAS-299-engrafted mice treated with PBS (black, n=7), CAR4-DNTs (red, n=7), or EV-DNTs (blue, n=6). Dots represent mean tumor volume and error bars represent SEM. Two-way ANOVA Tukey’s multiple comparison test was used for statistical analysis. (G) Kaplan-Meier curve showing the per cent survival of KARPAS-299-engrafted mice treated with PBS (black, n=7), CAR4-DNTs (red, n=7), or EV-DNTs (blue, n=5). Log-rank test was used for statistical analysis. (H) KARPAS-299 engrafted mice were sacrificed on day 30. Tumors were excised and KARPAS-299 cells were identified via staining with anti-HLA-B7 antibody. Left: Representative flow plots for CD3 and HLA-B7 staining of tumor samples from untreated, EV-DNT-treated, and CAR4-DNT-treated mice on day 30. KARPAS-299 cells are HLA-B7+; an HLA-B7− donor was used to manufacture EV-DNTs and CAR4-DNTs. Right: Number of DNTs detected by flow cytometry on day 30. Each dot represents the DNT count in the tumor sample of one mouse, horizontal line represents the mean, and error bar represents SEM. One-way ANOVA Tukey’s multiple comparison test was used for statistical analysis. *p<0.05; **p<0.01; ***p<0.001; ****p<0.0001. ANOVA, analysis of variance; CAR4, CD4-CAR; DNTs, double-negative T cells; EV, empty-vector; HLA, human leukocyte antigen; IL, interleukin; PBS, phosphate-buffered saline; PTCL, peripheral T-cell lymphoma; T-ALL, T-cell acute lymphoblastic leukemia.

