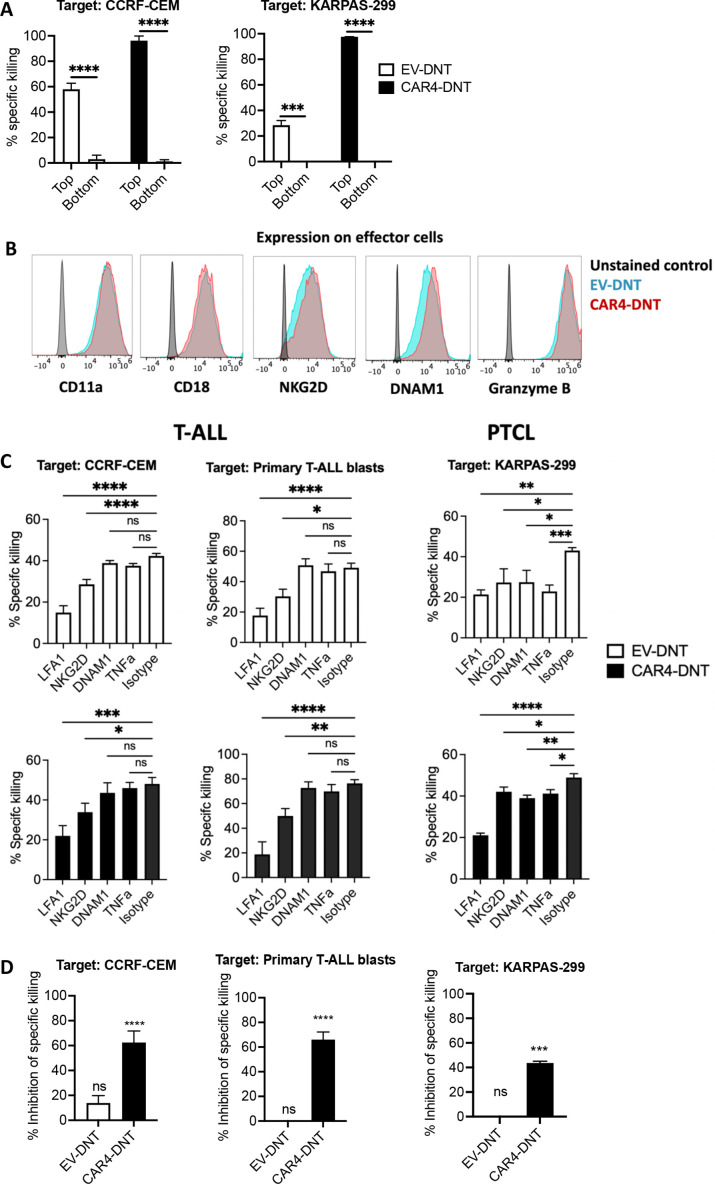
Figure 5.
Molecular mechanism involved in EV-DNT-mediated and CAR4-DNT-mediated killing of T-cell malignancies. (A) An in vitro transwell assay was conducted with a 0.4 µm pore membrane that separates the top and bottom compartments. The target cells, CCRF-CEM and KARPAS-299, were cocultured with EV-DNTs (white bars) and CAR4-DNTs (black bars) in the top compartment, while only target cells were alone in the bottom compartment. Per cent specific killing of the target in each compartment is shown, and error bars represent SEM. The experiment was independently performed two times, and representative data are shown. Two-way ANOVA Sidak’s multiple comparison test was used for statistical analysis. (B) Representative flow plots showing expression of LFA-1 subunits, CD11a and CD18, NKG2D, DNAM-1, and granzyme B on EV-DNTs (blue) and CAR4-DNTs (red). Histograms are representative of two independent experiments. (C) An in vitro cytotoxicity assay was conducted using EV-DNTs (white bars) and CAR4-DNTs (black bars) against CCRF-CEM, primary T-ALL blasts, and KARPAS-299, in the presence of LFA-1, NKG2D, DNAM-1, or TNF-α blocking antibody, or isotype controls. EV-DNTs and CAR4-DNTs were cocultured with the targets for 24 hours. The effector-to-target ratio was 2:1 or 4:1 for EV-DNT cocultures and 0.2:1 for CAR4-DNT cocultures. Per cent specific killing of the target in the presence of each blocking antibody or the isotype control is shown. Error bars represent SEM. Each experiment was done in triplicates, and data are a combination of three independently performed experiments. One-way ANOVA Dunnett’s multiple comparisons test was used for statistical analysis. (D) EV-DNTs (white bars) and CAR4-DNTs (black bars) were pretreated with DMSO or 100 nM CMA for 30 min and cocultured with CCRF-CEM (left), KARPAS-299 (middle), or primary T-ALL blasts (right) for 2 hours at a 2:1 effector-to-target ratio. Per cent inhibition of specific killing of targets by CMA pretreated effector cells relative to the DMSO control is shown, and error bars represent SEM. Data are a combination of three independently performed experiments. Student’s t-test was used for statistical analysis. *p<0.05; **p<0.01; ***p<0.001; ****p<0.0001. ANOVA, analysis of variance; CAR4, CD4-CAR; CMA, concanamycin A; DMSO, dimethyl sulfoxide; DNAM-1, DNAX accessory molecule-1; DNTs, double-negative T cells; EV, empty-vector; LFA-1, lymphocyte function-associated antigen-1; NKG2D, natural killer group 2D; PTCL, peripheral T-cell lymphoma; T-ALL, T-cell acute lymphoblastic leukemia; TNF-α, tumor necrosis factor-α.

