
Figure 2.
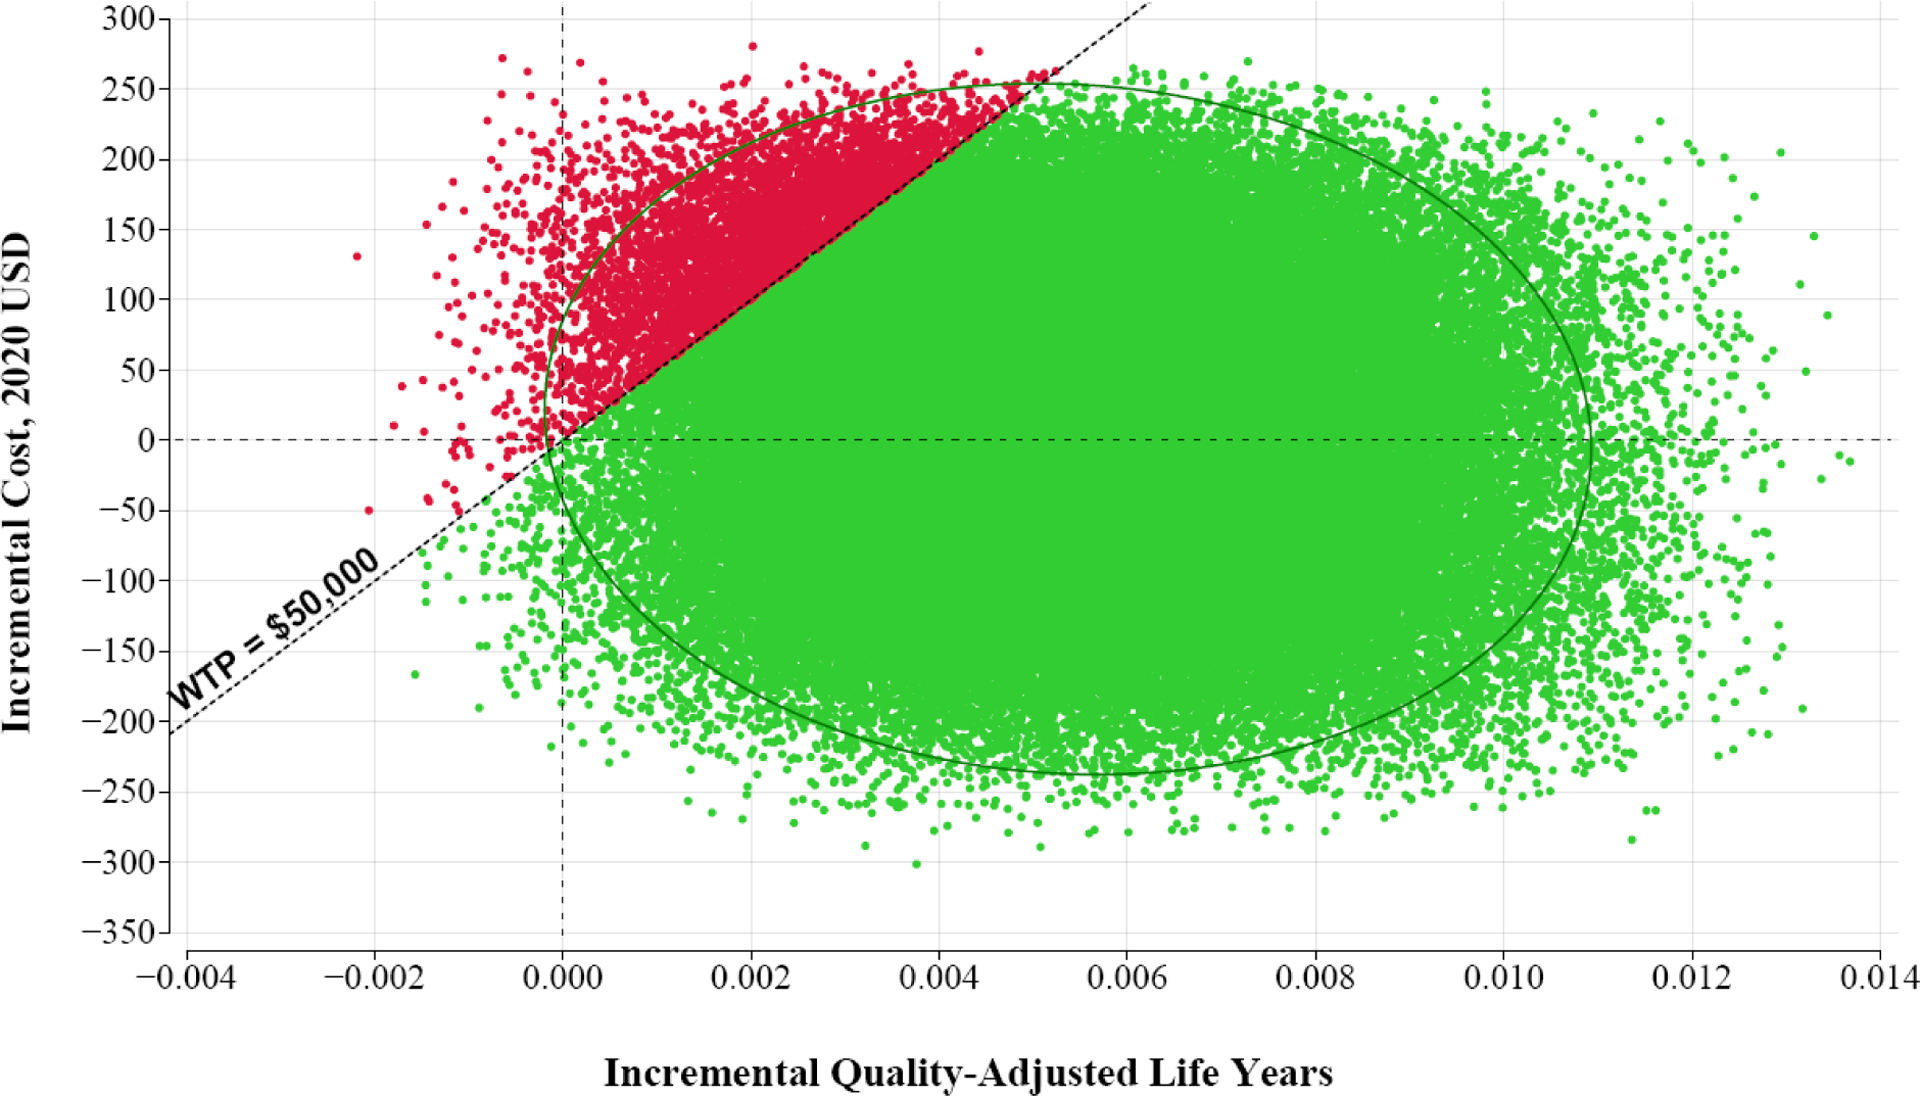
Monte Carlo plot of 100,000 model iterations from probabilistic sensitivity analysis
Each plotted point represents an iteration of the probabilistic sensitivity analysis. The diagonal line indicates a willingness-to-pay (WTP) threshold of $50,000 and the ellipse represents the 95% confidence interval. DPYD genotyping is preferred to the no screening strategy for green points below the WTP threshold.