. 2023 Jul 19;5(18):4703–4717. doi: 10.1039/d3na00280b

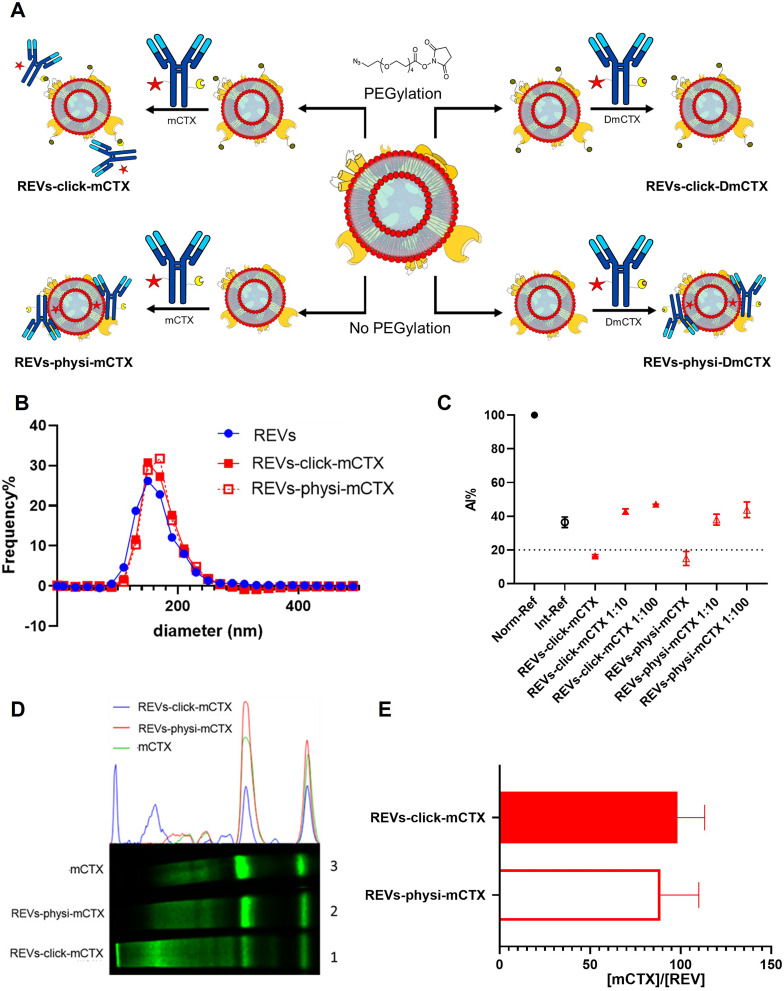
Fig. 2. REV surface functionalization by the chemical or physical strategy. (A) Schematic representation of the functionalization processes followed. (B) Size distribution of functionalized samples determined by NTA shows no significant differences compared to that of the native REVs. Data are expressed in frequency %. The diameter bin width has been set to 20 nm. N = 3. (C) In the CONAN assay,34 the Int-REF AI ratio defines the threshold below which the spectral redshift is only due to the interaction between the AuNPs and the EVs. Functionalized REVs were tested undiluted and after 10 and 100-fold dilutions. The dotted line represents the CONAN assay threshold for soluble protein detection (<20% AI ratio means that the soluble protein content is ≤0.05 μg μL−1) (D). SDS-PAGE and relative fluorescence densitometric profiles of REVs-click-mCTX (lane 1, 20 μL), REVs-physi-mCTX (lane 2, 20 μL) and mCTX (lane 3, 1 μg). (E) mCTX per REV yields of functionalized samples. Data are elaborated as the molar concentration of mCTX (see Fig. S3D) normalized by the molar concentration of REVs of the sample. N = 5.

Fig. 2