. 2023 Jul 19;5(18):4703–4717. doi: 10.1039/d3na00280b

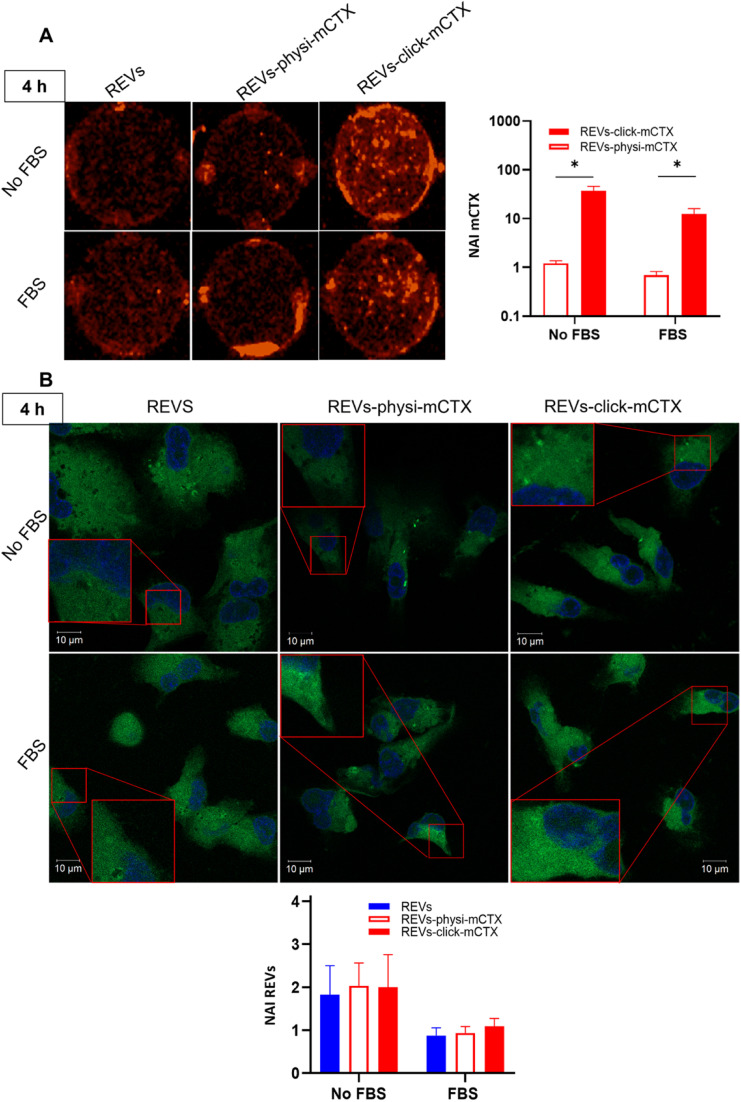
Fig. 5. (A) In vitro mCTX uptake assay. Fluorescence image and quantification of MDA-MB-231 cells after the treatment with REVs-click-mCTX and REVs-physi-mCTX at 4 h in the absence (no FBS) and in the presence of FBS. The red fluorescence is related to mCTX. *p value < 0.05. (B). In vitro REV uptake assay. Confocal microscopy image and quantification of MDA-MB-231 cells after the treatment with REVs-click-mCTX and REVs-physi-mCTX at 4 h in the absence (no FBS) and in the presence of FBS. The green fluorescence is related to MemGlow™ 488, while the blue is related to DAPI. *p value < 0.05. NAI = normalized adjusted intensity. The y axis is reported as a logarithmic scale for graphs in (A) and linear scale for (B).

Fig. 5