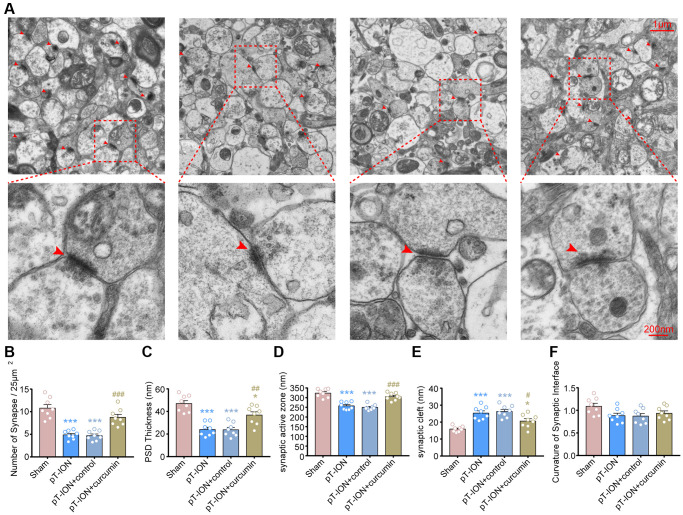
Figure 6.
The protective effects of curcumin on the density and ultrastructure of synapses of hippocampal CA1 region in pT-ION mice. (A) Representative TEM images showing the density and ultrastructure of synapses of hippocampal CA1 region in each group (scale bar: 1 μm and 200 nm). Bar graphs showing the number of synapses/25 μm2 (B), the thickness of the PSD (C), the length of the synaptic active zone (D), the width of the synaptic cleft (E), and the curvature of the synaptic interface (F) in each group. N = 8 mice/group. *P < 0.05 and ***P < 0.001 vs. sham group; #P < 0.05, ##P < 0.01 and ###P < 0.001 vs. pT-ION group, one-way ANOVA and Tukey’s test.

