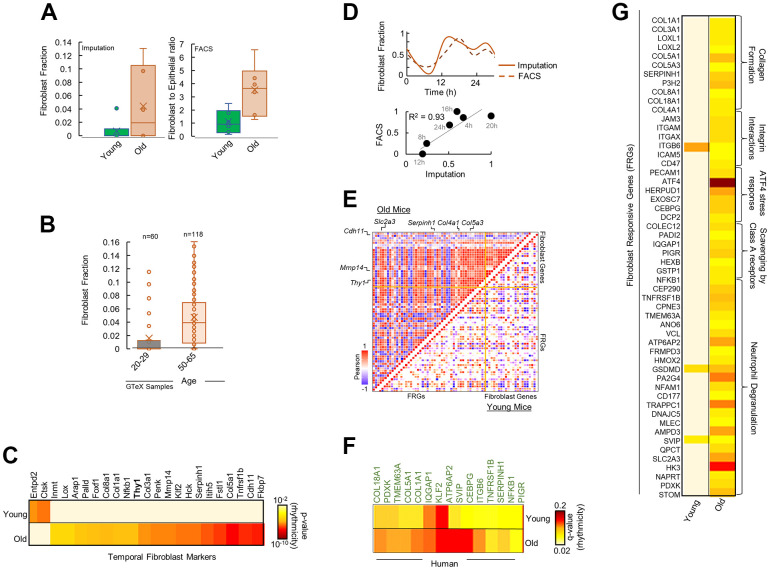
Figure 3.
Fibroblasts mediate differential rhythmicity in aged pancreas. (A) Bar plots for (left) fibroblast fraction obtained by imputation and (right) Fibroblast to epithelial ratio obtained by Fluorescence Activated Cell Sorting (FACS) analysis for young and old mice pancreas. (B) Bar plots for fibroblast fraction obtained by imputation for young and old human pancreas from 178 GTeX datasets. (C) Heatmap of significantly rhythmic genes indicative of fibroblast markers in young and old mice. Fibroblast marker Thy1/CD90 is shown in bold. Heatmap represents the p-value of rhythmicity. (D) Top: Comparison of temporal fibroblast fractions obtained by two independent methods: imputation and FACS. Bottom: Similarity between the estimated fibroblast fractions between imputations and FACS methods. (E) Pairwise correlation plot for fibroblast markers and fibroblast responsive genes (FRGs) in young (lower diagonal) and old (upper diagonal) mice. Colors represent the Pearson correlation coefficient. (F) Heatmap of significantly rhythmic FRGs in young and old, time-stamped human datasets. Heatmap represents the p-value of rhythmicity. (G) Heatmap of significantly rhythmic FRGs in young and old mice. Heatmap represents the p-value of rhythmicity.

