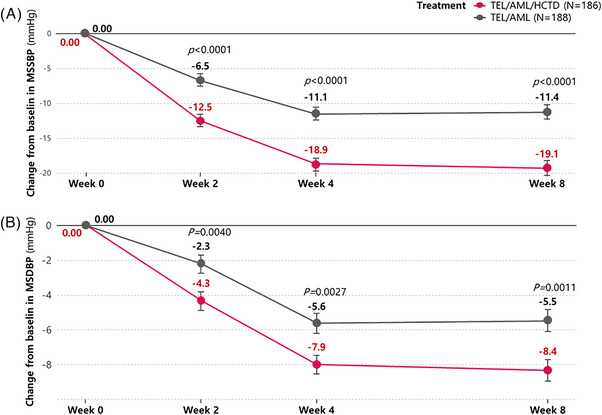
FIGURE 2.

Line graphs of changes in MSSBP and MSDBP from baseline to visit time according to time sequences. The changes of MSSBPs (A) and MSDBP (B) from baseline to week 2, 4, and 8 are significantly greater in TEL/AML/CHTD group (red line) than TEL/AML group (black line). MSSBP, mean sitting systolic blood pressure; MSDBP, mean sitting diastolic blood pressure; TEL/AML/CHTD, telmisartan/amlodipine/chlorthalidone; TEL/AML, telmisartan/amlodipine.
