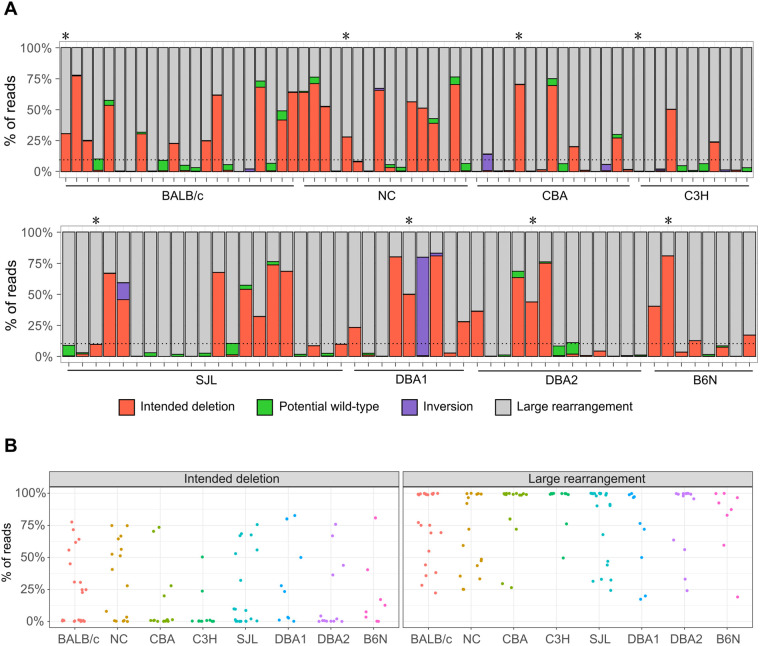
Fig. 3.
DAJIN report on the allele percentage. (A) DAJIN report on the allele percentage in the eight strains. Mouse strains are indicated on the x-axis. The percentages of reads with DAJIN-predicted allele types are indicated on the y-axis. The bar colour indicates each of DAJIN predicted allele types, including intended deletion, potential wild-type, inversion and large rearrangement. The horizontal dotted line represents 10% allele percentage. Asterisks denote G0 mice used in the creation of G1 mice. (B) Scatter plots of the percentage of reads on the intended deletion and large rearrangement alleles. Dots represent each mouse sample. Mouse strains are indicated by the different colours. The percentages of reads with DAJIN-predicted allele types are indicated on the y-axis.

