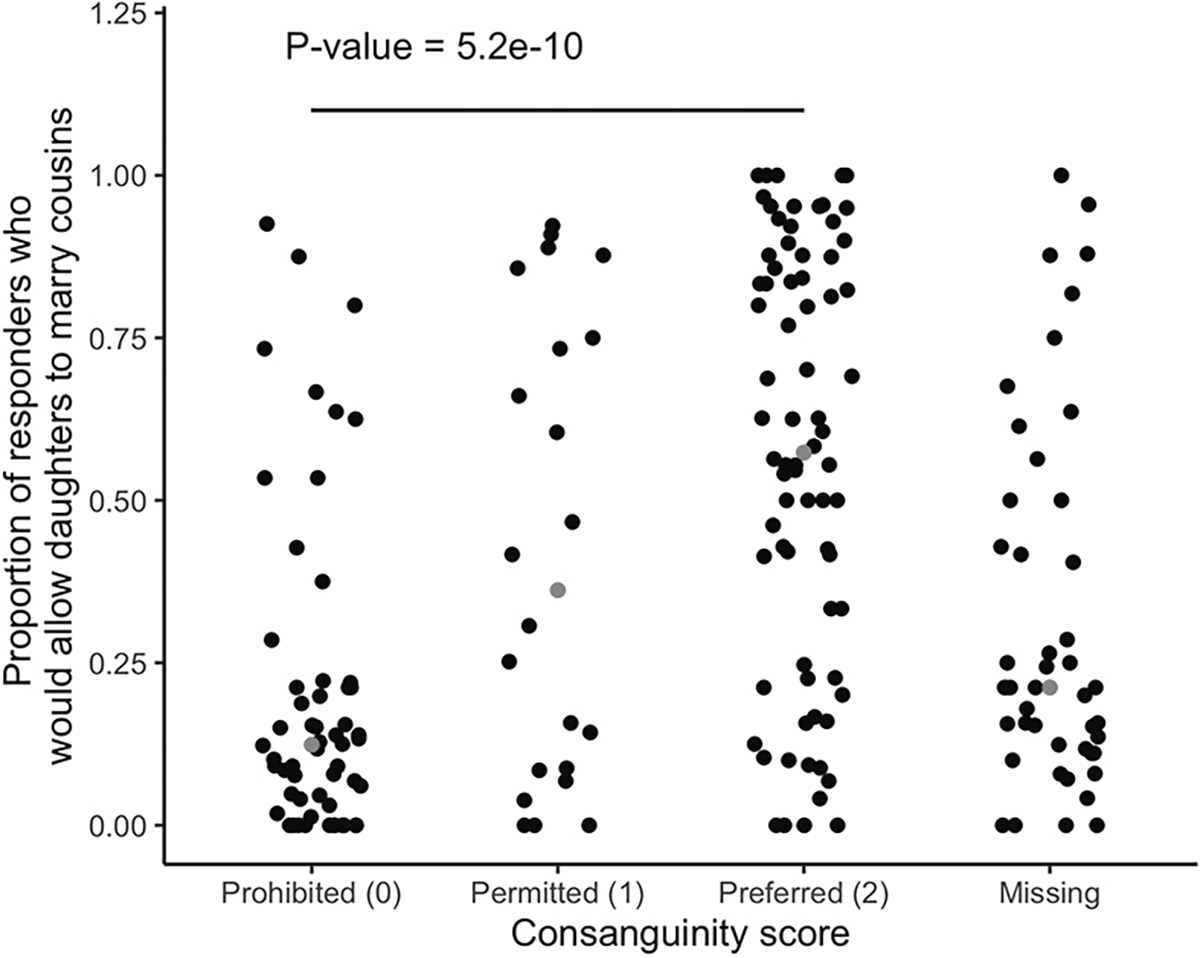
FIGURE 1.

Our consanguinity scores correspond well with survey data on whether cousin marriage is permitted in an individual’s community. The x-axis shows the consanguinity score assigned to each population, and the y-axis shows the proportion of survey participants in the 2011 Indian Health and Development survey (Desai and Vanneman 2018) who responded that people in their community would marry a daughter to her cousin. Each point is a population (matched using the caste name variable from the survey; total after excluding samples for which a consanguinity score could not be determined); gray points represent the median for that category. The proportion of responders who would allow daughters to marry their cousins is significantly different across the three classes: prohibited, permitted, and preferred (ANOVA p-value = 5.2 × 10⁻¹⁰).
