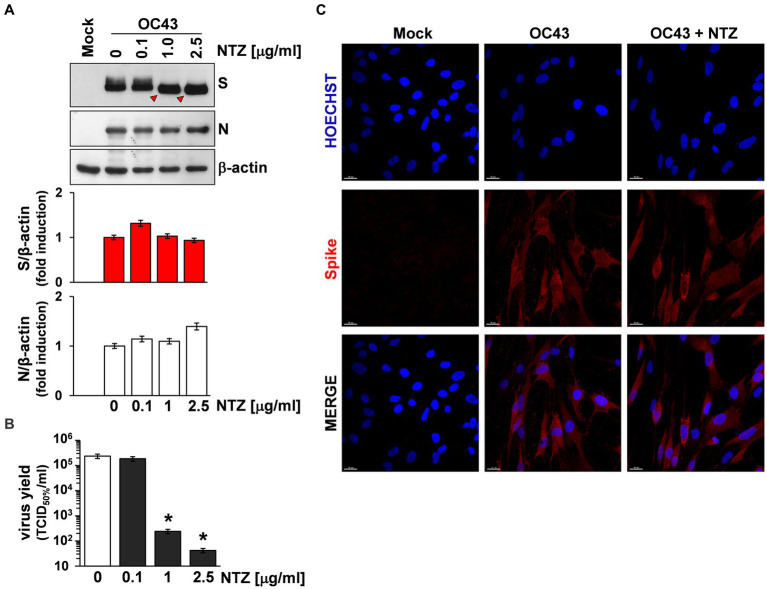
Figure 4.
Effect of Nitazoxanide on HCoV-OC43 spike expression. (A,B) MRC-5 cells were mock-infected or infected with HCoV-OC43 at an MOI of 0.5 TCID50/cell and treated with different concentrations of NTZ or vehicle immediately after the virus adsorption period. After 24 h, whole cell extracts (WCE) were analyzed for levels of viral S and N proteins by IB using anti-spike and anti-N HCoV-OC43 antibodies [(A) top], and quantitated by scanning densitometry. Relative amounts of S and N proteins were determined after normalizing to β-actin [(A) bottom]. The faster-migrating form of the S protein in NTZ-treated cells is indicated by red arrowheads. In the same experiment virus yield was determined at 24 h p.i. in the supernatant of infected cells by TCID50 infectivity assay (B). Data represent the mean ± S.D. of duplicate samples. *p < 0.01; ANOVA test. (C) Confocal images of HCoV-OC43 spike glycoprotein (red) in MRC-5 cells mock-infected or infected with HCoV-OC43 at an MOI of 0.5 TCID50/cell and treated with NTZ (1 μg/mL) or vehicle for 24 h. Nuclei are stained with Hoechst (blue). Merge images are shown. Scale bar, 20 μm.

