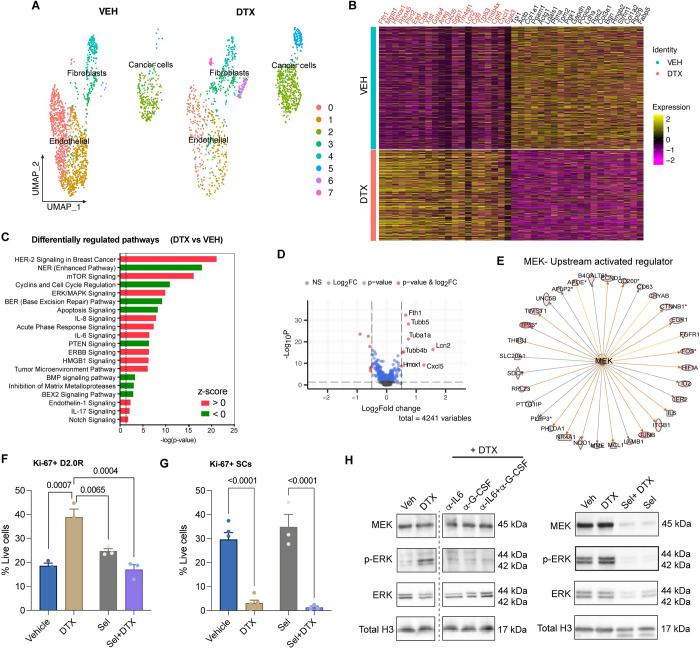
Fig 3. Single-cell transcriptomics revealed MEK signaling in docetaxel-mediated dormancy awakening.
(A) UMAP presentation of major cell type clusters from scRNA-SEQ analysis of vehicle (VEH) (n = 24) and docetaxel (DTX) (n = 36) treated TSOs. (B) Heatmap showing top 20 enriched genes in DTX and VEH datasets, respectively. (C) Pathways enrichment upon docetaxel treatment compared with vehicle controls based on 1,600 differentially expressed genes. Significance for enrichment is calculated based on Fisher’s exact test for each pathway are indicated on the x-axis (-log p-value). Color red or green indicates positive or negative z-score, respectively. (D) Volcano plot showing significantly differentially expressed protein-coding genes in cancer cells (D2.0R) based on RNA-seq of TSOs from docetaxel treated compared with vehicle-treated controls. Transcripts with absolute FC > 0.5 and adjusted P-value < 0.05 are highlighted in red. (E) Targets of MEK enriched in cancer cells. Colored lines indicate relationships between nodes, with orange lines showing enhancement and gold lines showing inhibition of a DEG by MEK. (F, G) Flow cytometric analysis of proliferating (Ki67+) cancer cells (G) and stromal cells (H) upon vehicle (n = 5), DTX (n = 5), selumetinib (n = 3) +/- docetaxel (n = 3) treatments. One-way ANOVA measurement with post hoc Dunnett’s multiple comparison test for flow cytometric analysis shows statistical significance between respective treatment groups. (H) Representative western blot images showing MEK, p-ERK, ERK, and Total H3 (loading control). Raw blot images can be found in S2 Raw Image. scRNA-seq source data is available on GEO (accession # GSE231350). Source data and source code can be found in S1 Data and S1 Code, respectively. DTX, docetaxel; scRNA-seq, single-cell RNA sequencing, TSO, tumor stromal organoid; UMAP, Uniform Manifold Approximation and Projection.

