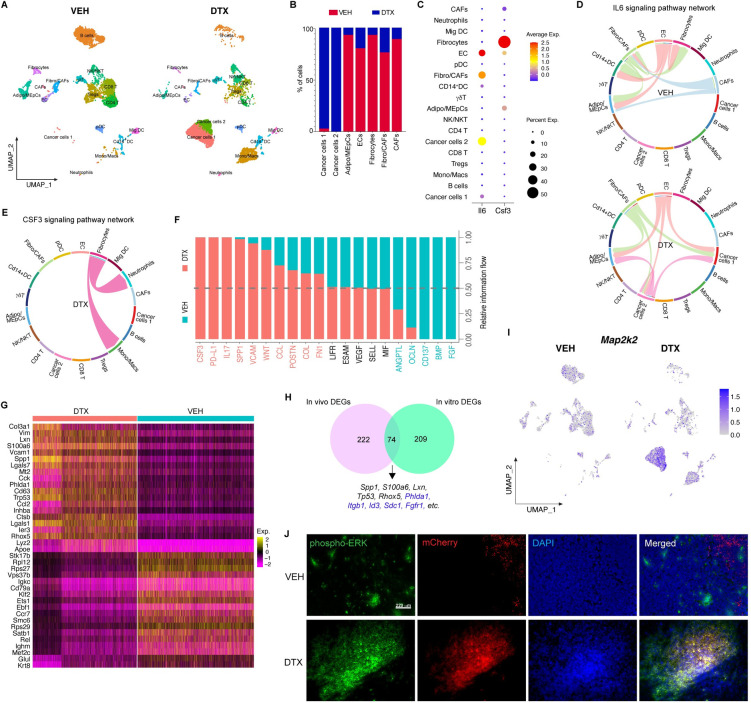
Fig 6. Single-cell RNA sequencing analysis of mouse mammary tumors.
(A) Split UMAP presentation of major cell types and associated clusters in vehicle (VEH) and docetaxel (DTX)-treated murine mfp/tumor (n = 2, each treatment group). (B) Percentage of cells from vehicle control and docetaxel-treated mice, per cluster for cancer cells and non-immune stromal cells. (C) Dot plot showing cluster wise expression of Il6 (IL-6) and Csf3 (G-CSF) by clusters. (D) Chord connections between cell types shows Il6 signaling network in vehicle and docetaxel datasets, respectively. (E) Chord connections between cell types showing Csf3 signaling network in DTX dataset. (F) Quantitatively comparing the information flow of each signaling pathway between cells from VEH- and DTX-treated samples. The overall information flow of a signaling network is calculated by summarizing all the communication scores in that network. (G) Heatmap showing top 20 enriched genes between cells from DTX- and VEH-treated samples, respectively. (H) Venn showing cancer cluster DEGs in vivo (pink) and in vitro (turquoise) with overlapping genes at the intersection. (I) Split feature plot showing Map2k (MEK) expression in DTX- vs. VEH-treated samples. (J) Representative IF images of mfp tumor from VEH- and DTX-treated mice showing immunostaining of phospho-ERK (green), DR.0R-mCherry (red), and nuclei (DAPI); scale bar = 220 μm. scRNA-seq files are accessible on GEO with the accession number GSE231350. Source data and source code can be found in S1 Data and S1 Code, respectively. DTX, docetaxel; mfp, mammary fat pad; UMAP, Uniform Manifold Approximation and Projection.

