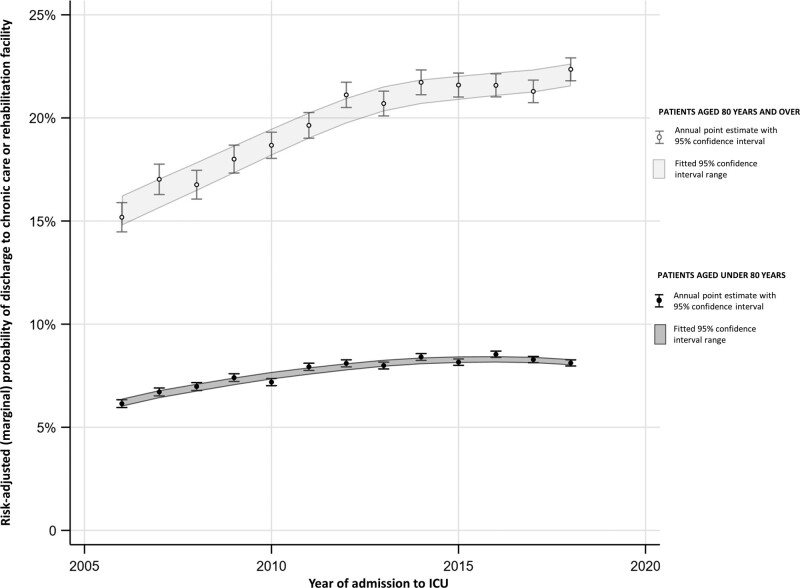
Figure 3.
New discharges to chronic care/nursing homes among survivors over time. The figure represents predicted (marginal) risk of new discharge to chronic care or rehabilitation from a regression model (date of ICU admission as a continuous variable, reported as a change in odds of new discharges per year, with an interaction term to test difference between those above or below 80 yr old) with fitted 95% CI, alongside aggregated annual mortality risk for each year. p value for difference in slopes between groups < 0.001.

