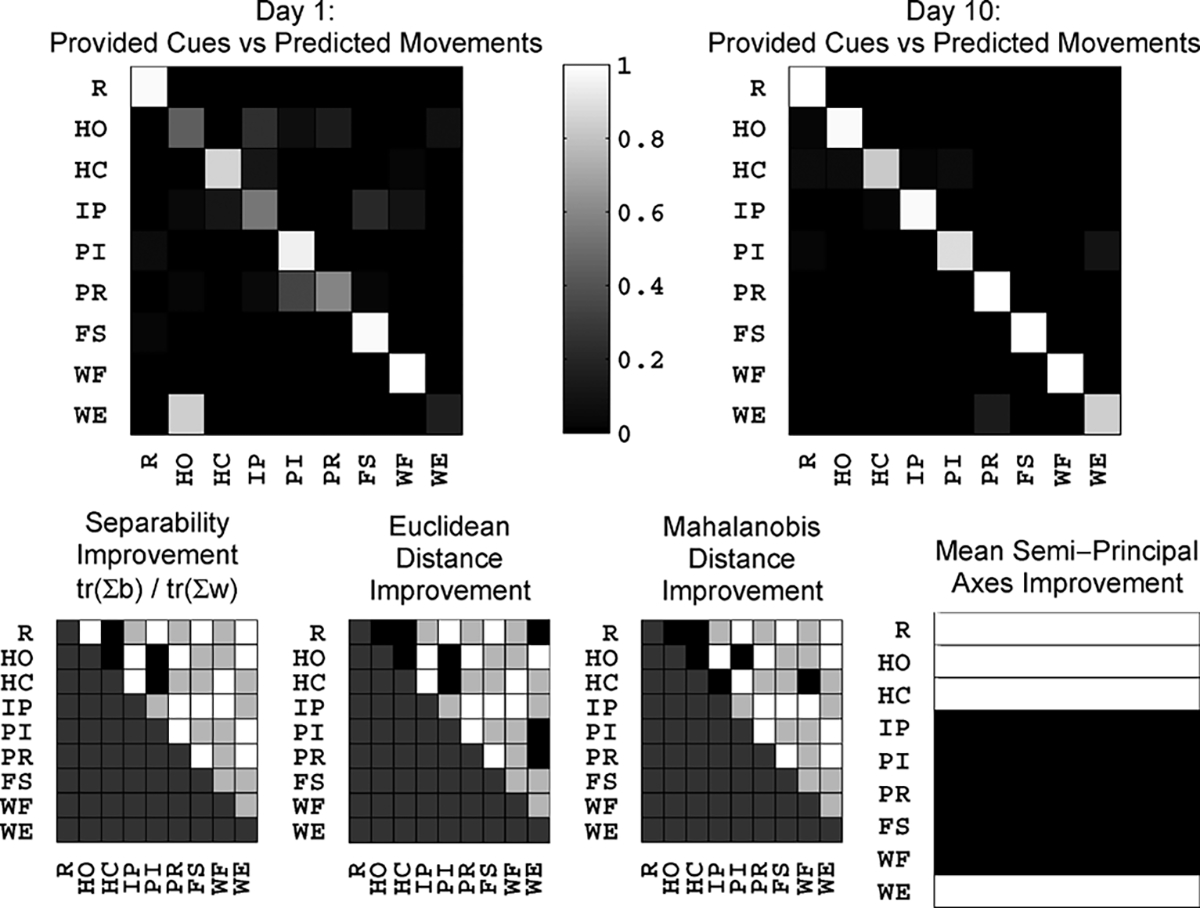
Fig. 5.

Presented here are confusion matrices denoting Subject 1’s Day 1 and Day 10 evaluation sessions. Additionally, four performance metrics are provided to explain the source of any positive or negative changes observed in the confusion matrices. As described in Section III-D, white squares signify improvement in the indicated metric. Black squares signify decline. Gray squares signify a lack of significant change in subject performance for the movements in question.
