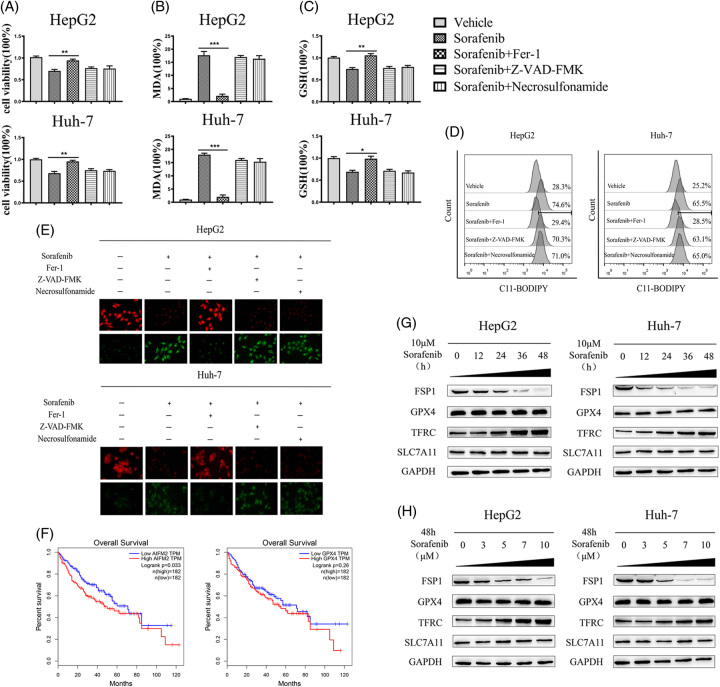
FIGURE 1.
Sorafenib downregulates FSP1 in HCC cells. (A–E) HCC cells were treated with sorafenib (10 μM), with or without the indicated inhibitors (ferrostatin-1, 1 μM; Z-VAD-FMK, 10 μM; necrosulfonamide, 10 μM) for 24 hours, then cell viability (A); MDA levels (B); GSH levels (C); C11-BODIPY flow cytometry analysis (D); and C11-BODIPY stain (× 400 magnification) (E) were assayed. (F) The Kaplan-Meier survival curves for patients with HCC were generated from the TCGA database based on FSP1 and GPX4 expression levels. (G and H) HCC cells were treated with 10 μM sorafenib at 0, 12, 24, 36, 48 hours or treated with 0, 3, 5, 7, 10 μM sorafenib at 48 hours. The levels of proteins were detected by western blot analysis. The data are the means ± SDs of the 3 independent experiments. *p < 0.05, **p < 0.01, and ***p < 0.001. Abbreviations: FSP1, ferroptosis suppressor protein 1; GPX4, glutathione peroxidase 4; GSH, glutathione; MDA, malondialdehyde; SLC7A11, solute carrier family 7 member 11; TFRC, transferrin receptor.

