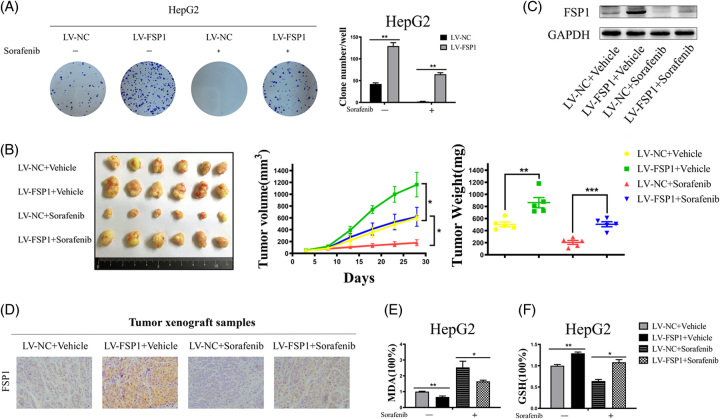
FIGURE 5.
FSP1 promoted tumor growth and enhanced the resistance to sorafenib-induced ferroptosis in vivo. (A) Colony formations were performed with vehicle or sorafenib (5 μM, 24 h) treated cells. The clones were counted after stained. (B) The subcutaneously implanted tumor samples were obtained by establishing animal models (n = 6/group). Collected the data and protracted the weight and volume growth curves of tumor xenograft samples. (C) Western blot analyses of the expression levels of FSP1 in tumor xenograft samples. (D) Representative images of FSP1 immunohistochemical staining with FSP1 antibodies in indicated groups (×400 magnification). (E and F) The relative levels of MDA and GSH of indicated tumor xenograft samples. The data are the means ± SD of the 3 independent experiments. *p < 0.05, **p < 0.01, and ***p < 0.001. Abbreviation: FSP1, ferroptosis suppressor protein 1.

