
FIG. 3.
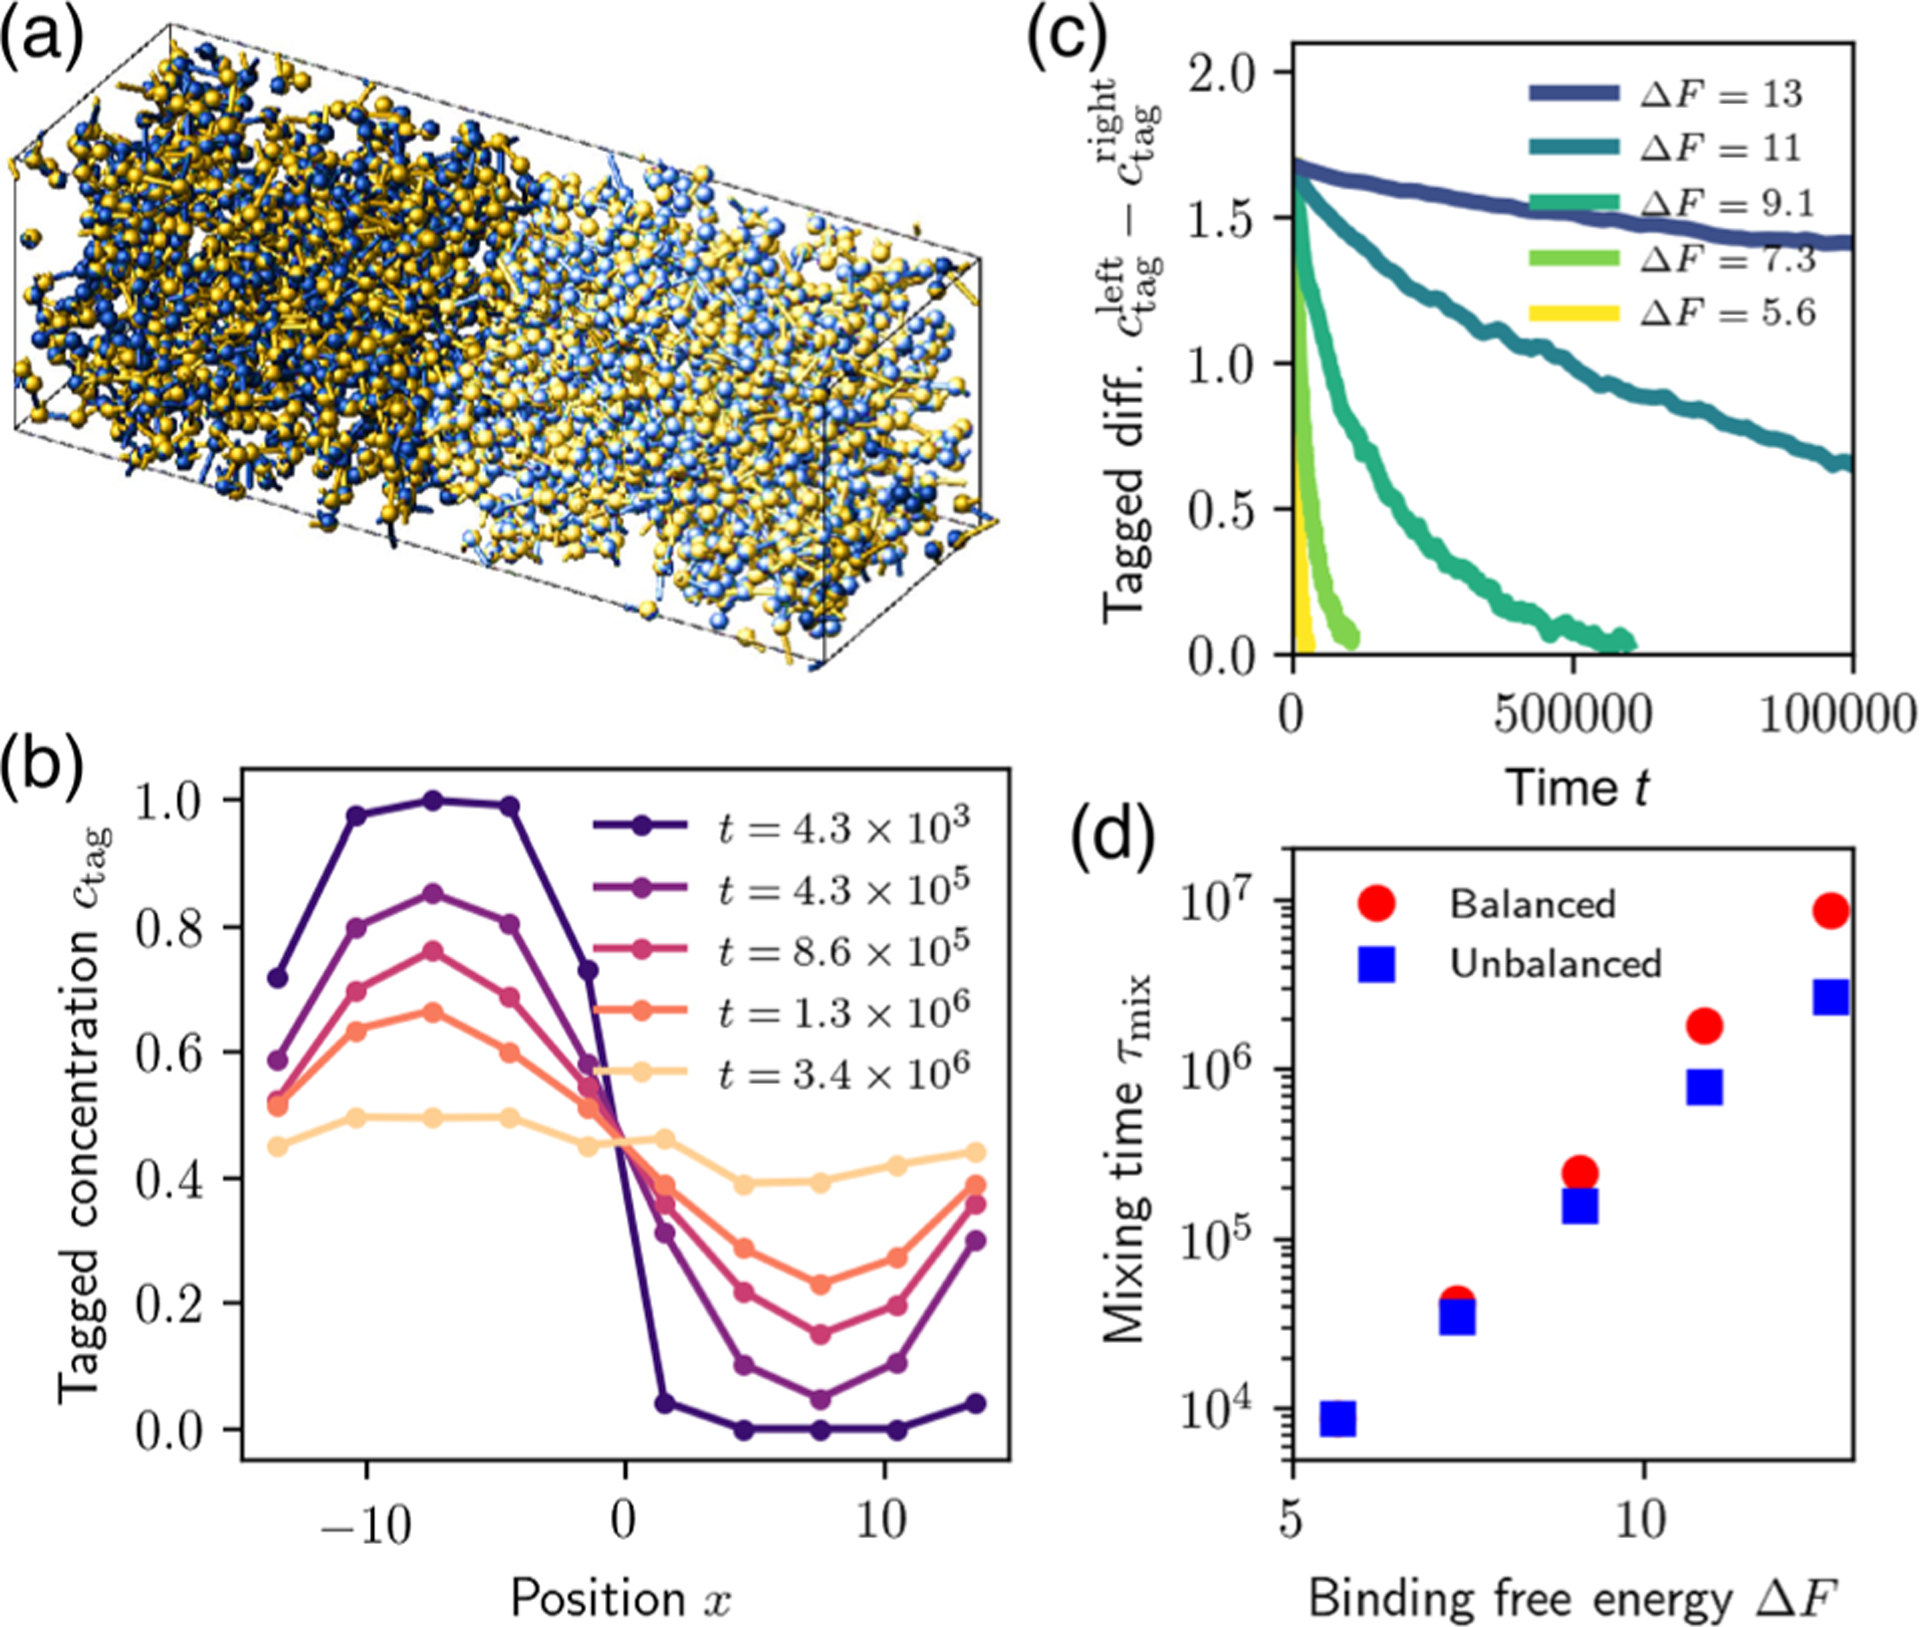
Composition controls mixing rate near equal stoichiometry. (a) Snapshot of an MD simulation with initially tagged particles on the left side of the box. (b) Normalized concentration profiles for tagged particles along the long axis at different times, for equal stoichiometry , showing slow relaxation towards the homogeneous state. (c) Relaxation of the tagged concentration difference between the two half-boxes, for different binding free energies. (d) Equilibration time as a function of binding strength. The unbalanced case has .