Figure 2.
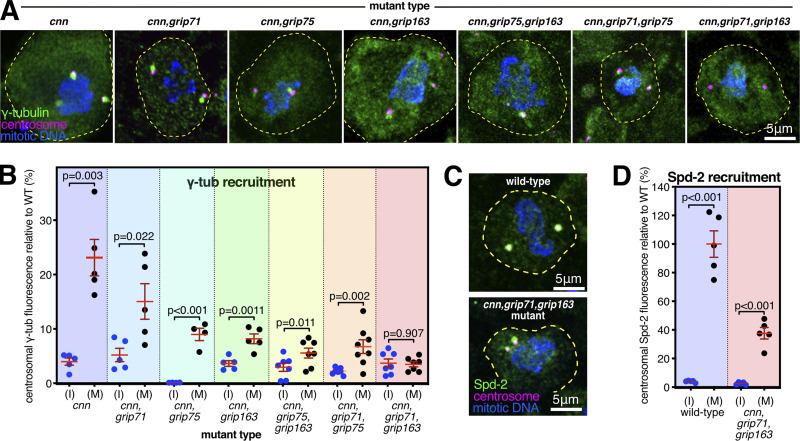
Recruitment of γ-tubulin complexes by Spd-2 is heavily dependent on the GCP4/5/4/6 core. (A) Fluorescence images of mitotic Drosophila brain cells from various mutant third instar larvae immunostained for γ-tubulin (green), mitotic DNA (blue), and Asl (centrioles, magenta). All mutants carry the mutant cnn allele to reveal the Spd-2 pathway of recruitment, along with mutant alleles for different combinations of γ-TuRC genes. Scale bar is 5 μm and applies to all images. (B) Graph showing average centrosomal fluorescence intensities of γ-tubulin (relative to wild-type) of interphase (blue dots) and mitotic (black dots) centrosomes from different genotypes (as indicated below). Each datapoint represents the average centrosome value from one brain. N numbers are the same interphase and mitosis of each condition: five for cnn,cnn,grip71, and cnn,grip163; four for cnn,grip75; seven for cnn,grip71,grip163 and cnn,grip75,grip163; and eight for cnn,grip71,grip75. Mean and SEM are indicated. Two-sided paired t tests were used to compare mean values of interphase and mitotic centrosomes within each genotype. Note that γ-tubulin accumulation at mitotic centrosomes is severely perturbed in the absence of the GCP4/5/4/6 core components Grip75GCP4 and Grip163GCP6, but is abolished only in the absence of Grip71 and Grip163GCP6. (C) Fluorescence images of mitotic Drosophila brain cells from wild-type or cnn,grip71,grip163 mutant third instar larvae immunostained for Spd-2 (green), mitotic DNA (blue), and Asl (centrioles, magenta). Scale bar is 5 μm and applies to both images. (D) Graph is in the same format as in B using two-sided paired t-tests to show a significant increase of centrosomal Spd-2 signal from interphase to mitosis in cnn,grip71,grip163 mutant cells, showing that the inability of these centrosomes to recruit γ-tubulin (A and B) is not due to an absence of Spd-2. N = 5 for all conditions.

